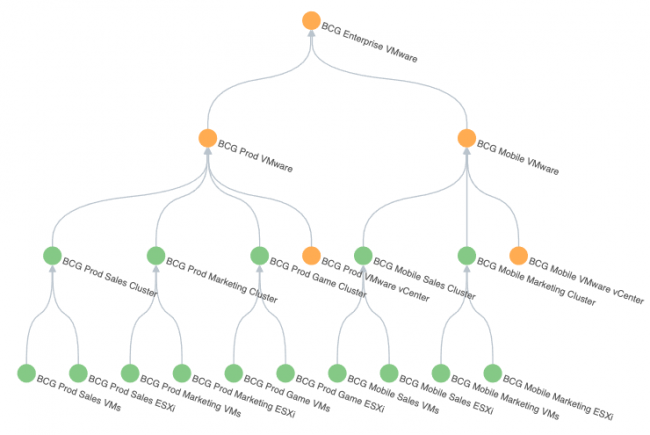
About the Content Pack for VMware Monitoring
The Content Pack for VMware Monitoring provides the elements necessary to monitor the performance of the main components in a VMware vSphere environment: ESXi servers, virtual machines, and datastores. The content pack provides a set of preconfigured KPI (key performance indicator) base searches, service templates with configured thresholds, and a sample service topology tree.
Installation
You can install the Content Pack for VMware monitoring after installing the Splunk App for Content Packs on the search head where you have installed ITSI. For installation instructions, see Install and configure the Content Pack for VMware Monitoring.
Content pack features
This content pack contains the following objects that facilitate the entire VMware configuration process:
VMware KPI base searches
The content pack includes the following KPI base searches:
VMWARE: VMware Datastores CapacityVMWARE: VMware Datastores I/OVMWARE: VMware ESXiVMWARE: VMware vCenterVMWARE: VMware Virtual Machines
The KPI base searches are specifically optimized for use with data from the Splunk Add-on for VMware Metrics. Each base search runs every minute with a five-minute lookback, using only the latest value on a per-entity basis. The 5-minute lookback ensures that you won't see N/A for less frequent data. The combination of "every-minute" and "latest" means that for data collected more frequently, the KPI status is updated as quickly as possible. Tune each base search to run at a frequency matching your data collection interval.
Services
The content pack includes the following sample services:
- VMware ESXi server
- VMware Virtual Machines
- VMware vSphere
- VMware vSphere Datastores
Service templates
|The content pack includes the following service templates:
- VMware ESXi servers
- VMware vCenter
- VMware Virtual Machines
- VMware vSphere Datastores
|The service templates are for ESXi servers, virtual machines, and datastores. The KPIs in the templates are tied to the VMware Metrics KPI base searches and have thresholds representing best practices. KPI thresholds are set to use Normal / Low / Medium at the aggregate level. Per-entity thresholds do not exceed Medium except for available disk space. The use of lower threshold levels for monitoring allows application-level KPIs to take a more prominent threshold level. For example, a server at 100% CPU isn't a critical issue if the apps running on that server are responding as they should.
Deployment requirements
Use the following table to determine ITSI version compatibility with various versions of the Content Pack for VMware Monitoring:
| Content pack version | ITSI version | Splunk Add-on for VMware Metrics |
|---|---|---|
| 1.2.0 | 4.17.x, 4.18.x | 4.2.3 |
| 1.1.1 | 4.17.x, 4.18.x | 4.2.3 |
| 1.0.2 | 4.11.0 or higher | n/a |
| 1.0.1 | 4.7.0 or higher | n/a |
| 1.0.0 | 4.2.1 - 4.6.2 | n/a |
Additional resources
- For ITSI deployment planning guidelines, see Plan your ITSI deployment in the Install and Upgrade Splunk IT Service Intelligence manual.
- For ITSI version compatibility with Splunk Enterprise versions, see Splunk products version compatibility matrix.
| Release Notes for the Content Pack for VMware Monitoring |
This documentation applies to the following versions of Content Pack for VMware Monitoring: 1.2.0

 Download manual
Feedback submitted, thanks!