Using calendar heat maps
| This feature is deprecated. |
|---|
| The calendar heat map is deprecated as of version 1.5.0. It will be archived and removed from Splunkbase on December 21, 2024. After removal, visualizations previously installed in environments will remain available but unsupported. |
Learn how to visualize data in a calendar heat map.
What calendar heat maps visualize
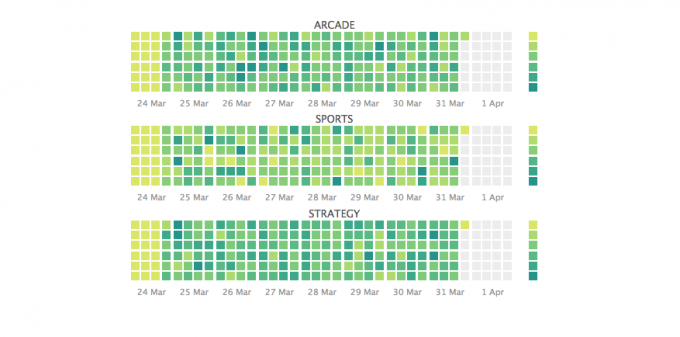
This visualization shows a metric over a configured time span. The time span appears as a grid with cells for each result. Cells color indicates relative metric density.
Use cases
Use a calendar heat map to visualize cyclical or other periodic patterns in a data set. For example, track retail purchasing trends or network activity patterns.
Data for calendar heat maps
Use any data that includes a metric you are tracking and timestamps for each event.
| Install a calendar heat map |
This documentation applies to the following versions of Calendar Heat Map (EOL): 1.0.0, 1.1.0, 1.2.0, 1.3.0, 1.4.0, 1.5.0, 1.5.1

 Download manual
Feedback submitted, thanks!