Check DB Connect installation health
Beginning with version 3.1.0, DB Connect provides health checks for the Splunk Access and customize health check to help you diagnose common issues.
Note:
- The Monitoring Console is only visible to users with the Splunk Enterprise admin role.
- The health check feature is available with Splunk version 6.5 and above.
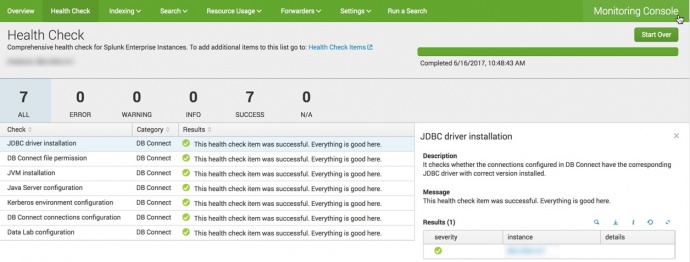
To use the health check, go to Settings of your Splunk instance and click Monitoring console. On the monitoring console page, click Health Check tab. There are seven preconfigured health check items provided by DB Connect. You can check the health of these items by selecting DB Connect and clicking Start, or leave the filters blank to run all available health checks.
The Splunk DB Connect health check items are:
- DB Connect connection configuration.
Checks that database connection configurations (identities and connections) are syntactically correct and that all dependencies between stanzas can be resolved. - Data lab configuration.
Checks that data access configurations (inputs, outputs, lookups) are syntactically correct and that all dependencies between stanzas can be resolved. - Configuration entries with incorrect syntax will not appear in the user interface, and must be corrected via configuration files.
- JDBC driver installation.
Checks that connections configured in DB Connect have the corresponding JDBC driver and version installed correctly. - DB Connect file permission.
Checks the existence and permission settings of the folders that the DB Connect processes will need to read and write: DB Connect application folder, checkpoint folder and log folder. - JVM installation.
Checks the existence and version of the JVM that DB Connect is configured to use to run individual commands and the Task Server. - Java server configuration.
Checks the JVM bootstrap conditions of the DB Connect Task Server. - Kerberos environment configuration.
Checks the configuration file for Kerberos is correctly configured to support Microsoft Active Directory authentication. Note that this item is only performed on Linux servers when at least one database connection uses Kerberos.
Note:
After the health check process is done, the result summary (how many succeeds, how many errors or warning messages) will be listed on the page. You can expand each health check item to see the detailed result.
Example 1: After checking all the health check items, all the health check items are succeeded.
Example 2: After checking all the DB Connect health check items, there are some issues in Data lab configuration and JDBC driver installation.
You can expand the health check item JDBC driver installation, it shows the error messages and suggested action provided by Splunk. You can also view the details of the issue in the Result table.
Besides installation health check, DB Connect also provides pre-built panels for you to monitor DB Connect input health, input performance and the connection health with database. See Monitor database connection health for details.
| Install and configure Splunk DB Connect on a single instance Splunk platform deployment | Configure Splunk DB Connect settings |
This documentation applies to the following versions of Splunk® DB Connect: 3.4.0, 3.4.1, 3.4.2, 4.0.0


 Download manual
Feedback submitted, thanks!