Dashboard overview
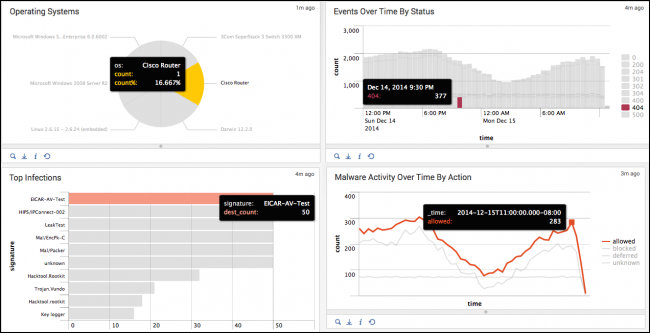
The Splunk App for Enterprise Security provides a range of dashboards that form a high-level overview of all security threats on your system.
Default dashboards
This section covers the dashboards that are visible by default as part of the Splunk App for Enterprise Security. You can modify which dashboards are displayed and the menus in which they appear.
By default, the Splunk App for Enterprise Security dashboards displayed are:
- Security Posture
- Incident Review
- Predictive Analytics
- Entity Investigator dashboards
- Advanced Threat
- Security Domain dashboards: Access, Endpoint, Network, Identity
- Audit
The Search dashboards contain Dashboards, Reports, Pivot, and Search.
Security Posture and Incident Review dashboards
The Security Posture and Incident Review dashboards provide a high-level overview of the Enterprise Security deployment. Both these dashboards use notable events, aggregated events that identify specific patterns or security issues that require investigation. Notable events are generated by searches called correlation searches. Initially, you will not see any content in these dashboards; content will appear when the underlying correlation searches have been enabled.
- Security Posture: "Are things OK?" The primary Enterprise Security dashboard. This provides a high-level visual summary and trend indication of the notable events across all of your deployment in the past 24 hours. This dashboard is continuously updated by real-time searches.
- Incident Review: "What should we do now?" Shows the details of all notable events identified within your deployment. From this dashboard you can monitor notable event activity, filter events by criteria such as urgency or domain, or manage the status of the notable events.
Domain dashboards
Provides visibility into the three primary domains of security: access protection, endpoint protection, and network protection.
- Access: A collection of dashboards relating to authentication data, such as login attempts and access control related events.
- Endpoint: A collection of dashboards relating to endpoint data, such as malware infections, system configuration, system metrics, patch history, and time synchronization information.
- Network: A collection of dashboards relating to network traffic data provided from devices, such as firewalls, routers, network-based intrusion detection systems, network vulnerability scanners, proxy servers, and hosts.
- Identity: A collection of dashboards relating to customer defined asset and identity information.
Each domain includes summary dashboards that give an overview of important security areas along with search dashboards that allow you to drill down into more detailed information.
- Centers: Provide an overview of the security events for a given domain, such as "Malware Center", and "Asset Center." The dashboards identify significant trends or relevant issues that may require attention.
- Analysis: Provide statistical information about events, such as "Traffic Size Analysis", and "HTTP User Agent Analysis." Using a variety of custom filters, you can locate and identify anomalous events to investigate.
- Search dashboards: Provide rapid access to domain-specific search tools without requiring advanced knowledge of the Splunk search language, such as "Proxy Search", and "Vulnerability Search."
- Audit dashboards: Provide introspection into the background processes and tasks. Audit dashboards are used to review and evaluate activity in the ES app by the system or users.
Common dashboard features
The domain dashboards include a number of features that are common to many of the dashboards.
Dashboard filters
Many dashboards have a filter bar to restrict the view on the current dashboard to events that match the selected criteria. Selections apply to the current dashboard only and do not affect other dashboards in Enterprise Security. Dashboard filters may not apply to all panels within a dashboard.
To use the filter, make selections and/or enter the desired text, use wildcards for strings if needed, adjust the time span, and search. For instance, many dashboards support selection of Business Unit or Category, which allows security managers and analysts to compare posture and patterns between different organizational units.
| Action | Filter behavior |
|---|---|
| Source based actions | success: The source of the action successfully completed the action (for example, successfully authenticated to the destination device)
failure: The source of the action did not successfully complete the action (for example, failed to authenticate to the destination device) |
| Device based actions | allowed: The device allowed the action
blocked: The device blocked the action |
| Endpoint or Malware based actions | allowed: The malicious executable was allowed to exist.
blocked: The malicious executable was prevented from performing the action. |
| Business Unit | Filter behavior |
|---|---|
| Business Unit | Filter based on the business unit of the host. Enter a string to match the business unit. Use the asterisk (*) wildcard to match any number of characters. Match is case-insensitive, and all text values must be lowercase.
Business Unit is a free form field implemented using the Splunk for Enterprise Security asset list and identities list. To use this filter, the asset list must be configured for the deployment. See the Enterprise Security Installation and Configuration Manual for more information. Note: Filtering by business unit includes unexepected systems because the search also considers the business unit of system owners. A filter of APAC includes systems based in APAC and systems based in other business units that are owned by APAC managers. |
| Category | Filter behavior |
|---|---|
| Category | Filter based on the categories to which the host belongs. The category names represent functional categories: such as server, workstation, and domain_controller; or compliance and security standards such as PCI. It is possible to filter on multiple categories by selecting each category to include in the results. The Enterprise Security app must have a category list and an asset list established to use the Category filter. |
Dashboard drilldowns
The tables and charts that comprise an Enterprise Security dashboard presents a consolidated view of the events. To see a detailed breakout of the events, click a point or segment on any chart, or a row in a table. The drilldown launches a detailed search that is driven by captured values from the location of the click.
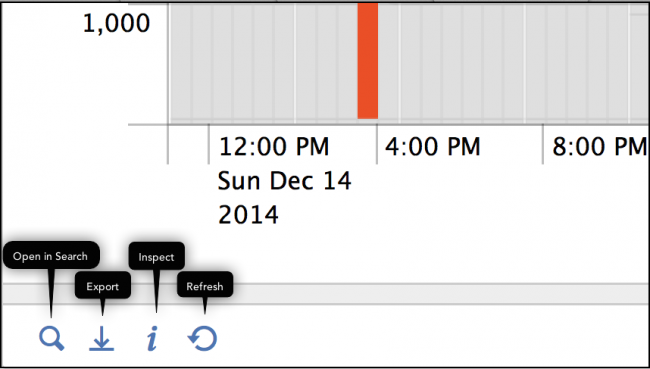
Panel Editor
Use the Panel Editor to access and view details of the search that drives the data in a panel. A number of options are available from icons that become visible when you mouse-over a panel:
- Open the search in the Search app.
- Export the results of the search in several formats.
- View the search in the Search Job Inspector.
- Refresh the search.
Workflow actions
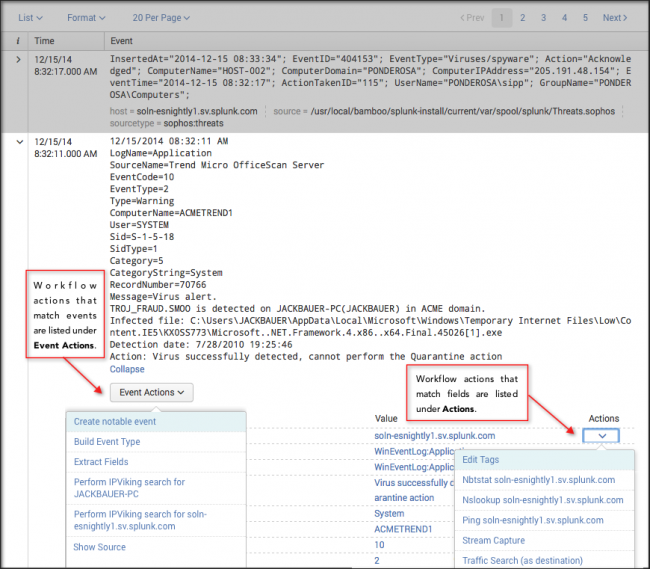
Workflow actions enable interactions between specified fields in your data and other applications or web resources. A simple workflow action is available form any source event containing a field with an IP address. When the action is chosen, an external WHOIS search based on the IP address value is initiated.
The Event Action and Action menus contain the relevant workflow actions, and are available on any dashboard that displays the source events. Use a drilldown from a dashboard panel to view source events.
Implement new workflow actions
For more information and examples on building workflow actions, see "Control workflow action appearance in field and event menus" in the Splunk Enterprise Knowledge Manager Manual.
New Dashboard Colors
A new color palette has been introduced for Enterprise Security that does not conflict with priority colors in the dashboards. The randomly assigned colors for event data are now easily distinguishable from these priority colors.
| Overview | Extreme Search |
This documentation applies to the following versions of Splunk® Enterprise Security: 3.2.1, 3.2.2, 3.3.0, 3.3.1, 3.3.2, 3.3.3


 Download manual
Feedback submitted, thanks!