Access dashboards
The Access dashboards monitor authentication attempts to network devices, endpoints, and applications. These dashboards are useful for detecting malicious authentication attempts, as well as identifying what systems users have accessed either in an authorized or unauthorized manner.
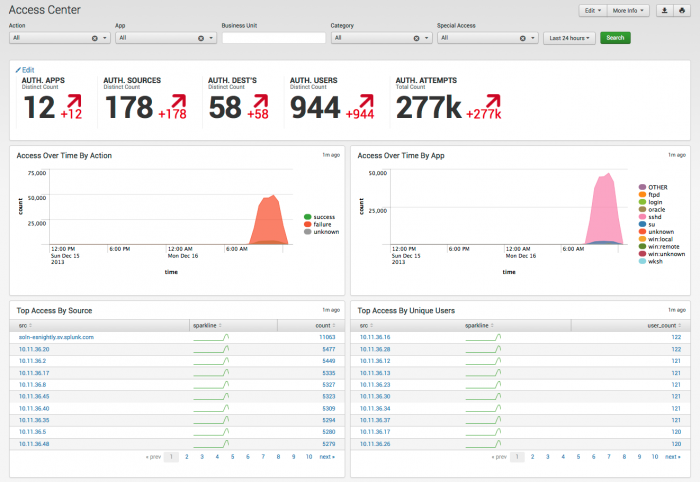
Access Center
The Access Center dashboard provides a summary of all authentication events in your environment. This summary is useful for identifying security incidents involving authentication attempts such as brute-force attacks or the use of clear text passwords, or for identifying authentications to certain systems in off-hours.
Use the filtering options at the top of the screen to limit which events are shown. Click chart elements or table rows on this dashboard to display the raw events.
Relevant data sources
Relevant data sources for this dashboard include login information, access information from firewalls, authentication information, and default account activity information.
How to configure this dashboard
1. Index relevant data sources from a device, application, or system in Splunk.
2. Map the data to the Authentication data model. See the Common Information Model Add-on Manual for more information. The Common Information Model fields bunit and category are derived by automatic identity lookup, and do not need to be mapped directly.
3. Tag the data with "authentication" and "notable".
Dashboard description
Access Center dashboard data is derived from the Authentication data model and accelerated automatically. To verify that authentication data is present, use this search:
| datamodel Authentication Authentication search
To verify that events are being accelerated by the data model correctly, use this search (be careful not to search across all time):
| tstats summariesonly=true count from datamodel=Authentication by user
For more information on distributed namespaces, see "Tscollect" and "Data Model" in the Splunk Search Reference Manual for more information about data models and namespaces.
Useful searches/Troubleshooting
| Troubleshooting Task | Search/Action | Expected Result |
|---|---|---|
| Verify that you have data from your network device(s) | sourcetype=<your_sourcetype_for_your_data> | Returns data from your network device(s). |
| Verify that access data is indexed in Splunk | tag=authentication OR tag=malware OR tag=attack OR tag=notable or | datamodel Authentication Authentication search |
Returns all access data from your device(s) |
| Verify that authentication data is normalized to the CIM properly | | datamodel Authentication Authentication search | table host, sourcetype, Authentication.* | Returns a table of events with the host, sourcetype, and data model object fields. |
Additional Information
For more information about using the Access Center, see "Access Center dashboard" in the Splunk App for Enterprise Security User Manual.
Access Tracker
The Access Center dashboard provides an overview of accounts that are newly active or newly inactive, including accounts that have been inactive for a period of time and recently became active again.
Use the filtering options at the top of the screen to limit which events are shown.
Clicking chart elements or table rows on this dashboard will display the raw events that are represented.
The Splunk App for Enterprise Security also includes correlation searches for accounts that have been active for a long period, or inactive accounts that become active. These correlation searches create notable events that show up in the Incident Review dashboard.
Relevant data sources
Access logs from operating systems, databases, and networking equipment are sources for the Access Tracker. Other sources can be applicable as well, such as application logs or building access logs.
How to configure this dashboard
1. Index relevant data sources from a device, application, or system in Splunk.
2. Map the data to Authentication data model. See the Common Information Model Add-on Manual for more information. The Common Information Model fields bunit and category are derived by automatic identity lookup, and do not need to be mapped directly.
3. Tag the data with "authentication".
Dashboard description
Access Tracker dashboard data is derived from the Authentication data model and accelerated automatically. To verify that authentication data is present, use this search:
| datamodel Authentication Authentication search
To verify that events are being accelerated by the data model correctly, use this search (be careful not to search across all time):
| tstats summariesonly=true count from datamodel=Authentication by user
For more information on distributed namespaces, see "Tscollect" and "Data Model" in the Splunk Search Reference Manual for more information about data models and namespaces.
Useful searches/Troubleshooting
| Troubleshooting Task | Search/Action | Expected Result |
|---|---|---|
| Verify that you have data from your network device(s) | sourcetype=<your_sourcetype_for_your_data> | Returns data from your network device(s). |
| Verify that access data is indexed in Splunk | tag= authentication or | datamodel Authentication Authentication search |
Returns all access data from your device(s) |
| Verify that authentication data is normalized to the CIM properly | | datamodel Authentication Authentication search | table host, sourcetype, Authentication.* | Returns a table of events with the host, sourcetype, and data model object fields. |
Additional information
For more information about using the Access Tracker, see "Access Tracker dashboard" in the Splunk App for Enterprise Security User Manual.
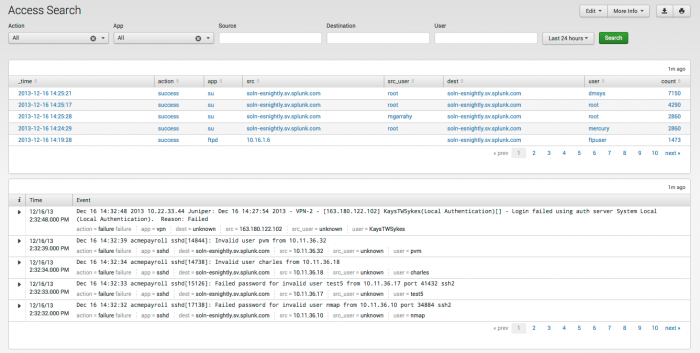
Access Search
The Access Search dashboard is used to search for specific authentication-related events. Access Search is similar to the normal Splunk search dashboard, but provides an additional search filters that helps to search for authentication events.
Use the filtering options at the top of the screen to limit which events are shown. Click on an event in the top panel to open the raw search.
Relevant data sources
Relevant data sources for the Access Search dashboard include access logs from operating systems, databases, and networking equipment. Other sources can be applicable as well, such as application logs or building access logs.
How to configure this dashboard
1. Index relevant data sources from a device, application, or system in Splunk.
2. Map the data to the Authentication data model. See the Common Information Model Add-on Manual for more information. The Common Information Model fields bunit and category are derived by automatic identity lookup, and do not need to be mapped directly.
3. Tag the data with "authentication" and "notable".
Dashboard description
Access Search dashboard data is derived from the Authentication data model and accelerated automatically. To verify that authentication data is present, use this search:
| datamodel Authentication Authentication search
To verify that events are being accelerated by the data model correctly, use this search (be careful not to search across all time):
| tstats summariesonly=true count from datamodel=Authentication by user
For more information on distributed namespaces, see "Tscollect" and "Data Model" in the Splunk Search Reference Manual for more information about data models and namespaces.
Useful searches/Troubleshooting
| Troubleshooting Task | Search/Action | Expected Result |
|---|---|---|
| Verify that you have data from your network device(s) | sourcetype=<your_sourcetype_for_your_data> | Returns data from your network device(s). |
| Verify that access data is indexed in Splunk | tag=authentication or | datamodel Authentication Authentication search |
Returns all data from your device(s) |
| Verify that authentication data is normalized to the CIM properly | | datamodel Authentication Authentication search | table host, sourcetype, Authentication.* | Returns a table of events with the host, sourcetype, and data model object fields. |
Additional Information
For more information about using the Access Search dashboard, see "Access Search dashboard" in the Splunk App for Enterprise Security User Manual.
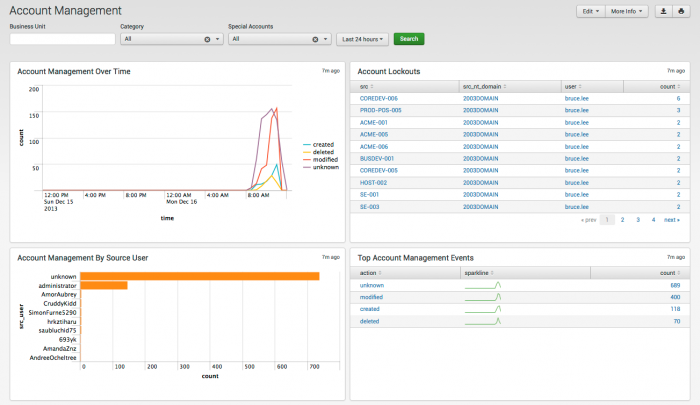
Account Management
The Account Management dashboard shows changes to user accounts, such as account lockouts, newly created accounts, disabled accounts, and password resets.
Use the filtering options at the top of the screen to limit which events are shown. Click on chart elements or table rows to display the raw events represented.
Relevant data sources
Relevant data sources for the Account Management dashboard include access logs from operating systems, databases, and networking equipment. Other sources can be applicable as well, such as application logs or building access logs.
How to configure this dashboard
1. Index relevant data sources from a device, application, or system in Splunk.
2. Map the data to the Change Analysis data model. See the Common Information Model Add-on Manual for more information. The Common Information Model fields bunit and category are derived by automatic identity lookup, and do not need to be mapped directly.
3. Tag the data with "account" AND ("management" OR "lockout")
Dashboard description
Account Management dashboard data is derived from the Change_Analysis data model and accelerated automatically. To verify that authentication data is present, use this search:
| datamodel Change_Analysis Account_Management search
To verify that events are being accelerated by the data model correctly, use this search (be careful not to search across all time):
| tstats summariesonly=true count from datamodel=Change_Analysis by user
For more information on distributed namespaces, see "Tscollect" and "Data Model" in the Splunk Search Reference Manual for more information about data models and namespaces.
Useful searches/Troubleshooting
| Troubleshooting Task | Search/Action | Expected Result |
|---|---|---|
| Verify that you have data from your network device(s) | sourcetype=<your_sourcetype_for_your_data> | Returns data from your network device(s). |
| Verify that access data is indexed in Splunk | tag=authentication tag=account AND (management OR lockout) or | datamodel Change_Analysis Account_Management search |
Returns all data from your device(s) |
| Verify that authentication data is normalized to the CIM properly | | datamodel Change_Analysis Account_Management search | table host, sourcetype, All_Changes.* | Returns a list of events and the specific account management fields of data populated from your device(s) |
Additional Information
For more information about using the Account Management dashboard, see "Account Management dashboard" in the Splunk App for Enterprise Security User Manual.
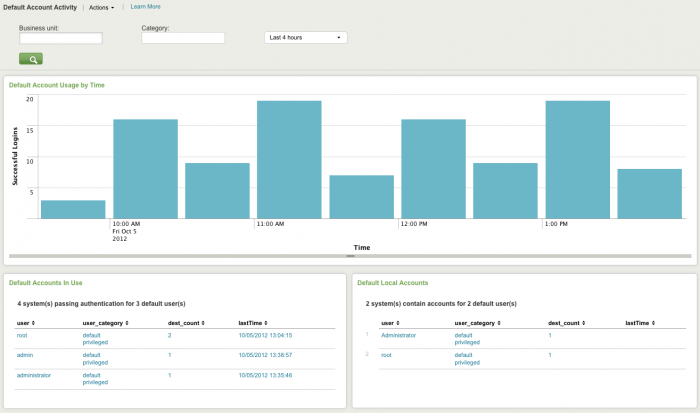
Default Account Activity
The Default Account Activity dashboard shows activity on "default accounts", that is, out-of-the-box accounts that are enabled by default on various systems, including network infrastructure devices, databases, and applications. Default accounts have well-known passwords and are often not disabled properly when the system is deployed.
In addition, you may need to monitor or investigate authorized use of a default account. Many security policies require that default accounts be disabled. When security policies allow the use of default accounts, it is important to make sure that the password has been changed from the default. Abnormal or non-compliant behavior can indicate security threats or policy violations. If your organization has a policy restricting default accounts, make sure to monitor this dashboard on a regular basis.
Use the filtering options at the top of the screen to limit which events are shown. You can configure new data inputs through Splunk Settings, or manage the list of default accounts through Enterprise Security Configuration. Default accounts are those that have a category of 'default' in the Identities table.
Clicking chart elements or table rows on this dashboard displays the raw events that are represented.
Relevant data sources
Relevant data sources for the Default Account Activity dashboard include out-of-the-box accounts that are enabled by default on various systems, including network infrastructure devices, databases, and applications.
How to configure this dashboard
1. Index relevant data sources from a device, application, or system in Splunk.
2. Map the data to the Authentication data model. See the Common Information Model Add-on Manual for more information. The Common Information Model fields bunit and category are derived by automatic identity lookup, and do not need to be mapped directly.
3. Tag the data with "account" AND "local" AND ("default" OR "privileged").
4. Add any default accounts to the your identity table.
5. Set the category field to default in the your identity table for each account that is considered a default account.
6. [Optional] Set the business unit field bunit in the Identity table to the appropriate business unit for each account that is considered a default account. Typically, default accounts are not assigned to a specific business unit, since default accounts are not associated with a specific individual.
Report description
Access Center dashboard data is derived from the Authentication data model and accelerated automatically. To verify that authentication data is present, use this search:
| datamodel Authentication Default_Authentication search
To verify that events are being accelerated by the data model correctly, use this search (be careful not to search across all time):
| tstats summariesonly=true count from datamodel=Authentication by user
For more information on distributed namespaces, see "Tscollect" and "Data Model" in the Splunk Search Reference Manual for more information about data models and namespaces.
Useful searches / Troubleshooting
| Troubleshooting Task | Search/Action | Expected Result |
|---|---|---|
| Verify that you have data from your network device(s) | sourcetype=<your_sourcetype_for_your_data> | Returns data from your network device(s). |
| Verify that access data is indexed in Splunk | tag=account AND local AND (default OR privileged) | Returns all tagged default account activity data from your device(s) |
| Verify that access attempts for default users are returned | | datamodel Authentication Default_Authentication search | Returns a list of all default account activity |
| Verify that authentication data is normalized to the CIM properly | | datamodel Authentication Default_Authentication search | table host, sourcetype, Authentication.Default_Authentication.* | Returns a list of events and the specific account management fields of data populated from your device(s) |
Additional information
For more information about using the Default Account Activity dashboard, see "Default Account Activity dashboard" in the Splunk App for Enterprise Security User Manual.
| Security Domains | Endpoint dashboards |
This documentation applies to the following versions of Splunk® Enterprise Security: 3.1, 3.1.1, 3.2, 3.2.1, 3.2.2


 Download manual
Feedback submitted, thanks!