Access dashboards
The Access Protection domain monitors authentication attempts to network devices, endpoints, and applications within the organization. Access Protection is useful for detecting malicious authentication attempts as well as identifying what systems users have accessed either in an authorized or unauthorized manner.
Access Center dashboard
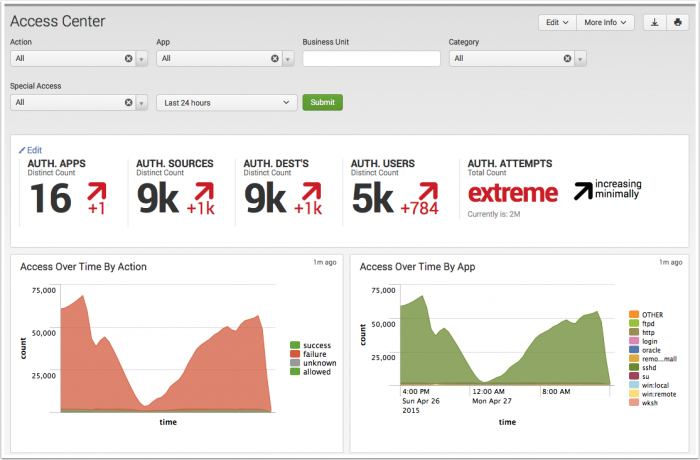
The Access Center provides a summary of all authentication events. This summary is useful for identifying security incidents involving authentication attempts such as brute-force attacks, or the use of clear text passwords, or for identifying authentications to certain systems in off-hours.
Dashboard filters
Use the available dashboard filters to refine the results displayed on the dashboard panels. The filters do not apply to key security indicators.
| Filter by | Description | Action |
|---|---|---|
| Action | Filter based upon authentication success or failure. | Drop-down: select to filter by |
| App | Filter based upon authentication application. | Drop-down: select to filter by |
| Business Unit | A group or department classification for the identity. | Text field. Empty by default. Wildcard strings with an asterisk (*) |
| Category | Filter based on the categories to which the host belongs. For more information, see "Dashboard Filters" in the Installation and Configuration manual | Drop-down: select to filter by |
| Special Access | Restricts the view to events related to privileged access. An account that is known to have administrator or super-user access is considered privileged, such as root or administrator accounts. This list of accounts can be configured using Configure > Lists and Lookups > Default Accounts. | Drop-down: select to filter by |
| Time Range | Select the time range to represent. | Drop-down: select to filter by |
Dashboard Panels
| Panel | Description |
|---|---|
| Access Over Time By Action | Displays the count of authentication events over time by action. |
| Access Over Time By App | Displays the count of authentication events over time by app. For example, "win:local" refers to the local authentication performed on a Windows system and "win:remote" refers to remote API access. |
| Top Access By Source | Displays a table of highest access counts by source. This table is useful for detecting brute force attacks, since aggressive attempts to authenticate display a disproportionate number of auth requests. |
| Top Access By Unique Users | Displays a table of the sources that generated the most authentication events by count. |
Troubleshooting
For information about troubleshooting, see "Troubleshooting Access dashboards" in this topic.
Access Tracker dashboard
The Access Tracker dashboard gives an overview of accounts that are newly active or newly inactive, including accounts that have been inactive for a period of time and recently became active again. It is not uncommon for accounts to incorrectly remain on the system when a user leaves the organization. These accounts are often vulnerable to attackers. It is a good idea to check this dashboard on a regular basis per the enterprise security policy to see inactive accounts. In addition, a security analyst may use this dashboard during an investigation to identify suspicious accounts and look more closely at what those users have been doing.
Dashboard filters
Use the available dashboard filters to refine the results displayed on the dashboard panels. The filters do not apply to key security indicators.
| Filter by | Description | Action |
|---|---|---|
| Business Unit | A group or department classification for the identity. | Text field. Empty by default. Wildcard strings with an asterisk (*) |
| Category | Filter based on the categories to which the host belongs. For more information, see "Dashboard Filters" in the Installation and Configuration manual | Drop-down: select to filter by |
| Time Range | Select the time range to represent. | Drop-down: select to filter by |
Dashboard Panels
| Panel | Description |
|---|---|
| First Time Access - Last 7 days | Displays new account access by user and destination. |
| Inactive Account Usage - Last 90 days | Displays accounts that were inactive for a period of time, but that have shown recent activity. |
| Completely Inactive Accounts - Last 90 days | Displays accounts that have shown no activity. Use this panel to identify accounts that should be suspended or removed. If the organization has a policy that requires password change after a specified interval, then accounts that have shown no activity for more than that interval are known to be inactive. This panel also indicates the effectiveness of the enterprise's policy for closing accounts. If there are a large number of inactive accounts, the process may need to be reviewed. |
| Account Usage For Expired Identities - Last 7 days | Displays activity for accounts that are suspended within the specified time frame. Use this panel to verify that accounts that should no longer have activity are not being used. |
Troubleshooting
For information about troubleshooting, see "Troubleshooting Access dashboards" in this topic.
Access Search dashboard
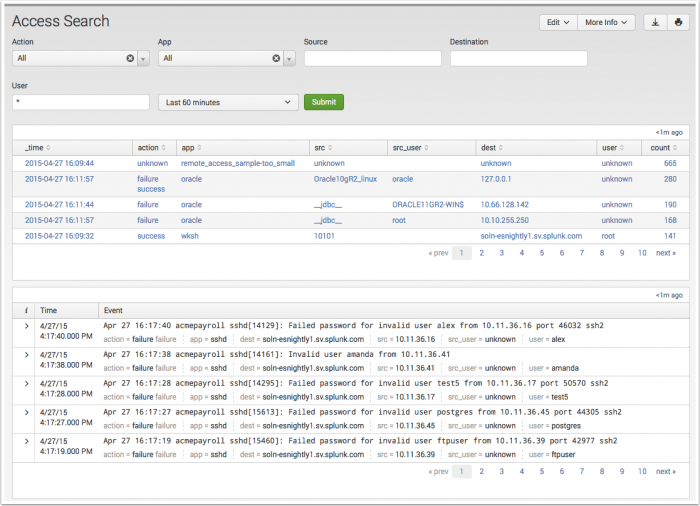
Use the Access Search dashboard to find specific authentication events. The dashboard is used in ad-hoc searching of authentication data, but is also the primary destination for drilldown searches used in the Access Anomalies dashboard panels. The Access Search page displays no results by default unless it was opened in response to a drilldown action, or the user sets a filter and/or time range and chooses Submit.
Dashboard filters
Use the available dashboard filters to refine the results displayed on the dashboard panels. The filters do not apply to key security indicators.
| Filter by | Description | Action |
|---|---|---|
| Action | Filter based upon authentication success or failure. | Drop-down: select to filter by |
| App | Filter based upon authentication application. | Drop-down: select to filter by |
| Source | A string that the source field src must match. |
Text field. Empty by default. Wildcard strings with an asterisk (*) |
| Destination | A string that the destination field dest must match. |
Text field. Empty by default. Wildcard strings with an asterisk (*) |
| User | A string that the user field user must match. |
Text field. Empty by default. Wildcard strings with an asterisk (*) |
| Time Range | Select the time range to represent. | Drop-down: select to filter by |
Troubleshooting
For information about troubleshooting, see "Troubleshooting Access dashboards" in this topic.
Account Management dashboard
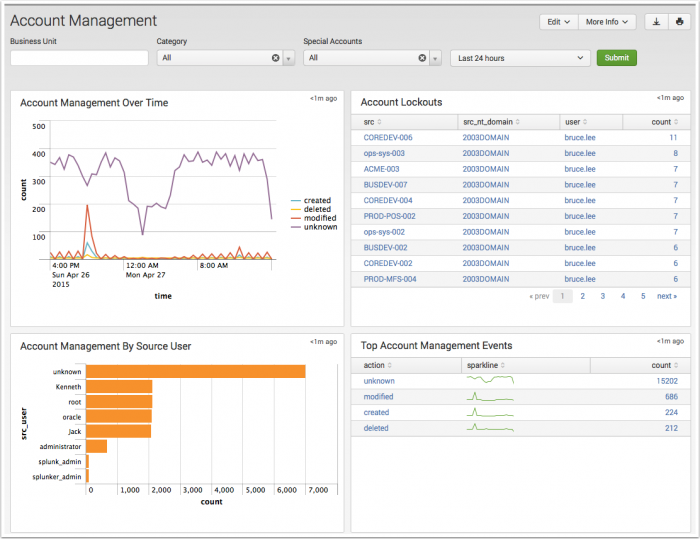
The Account Management dashboard shows changes to user accounts, such as account lockouts, newly created accounts, disabled accounts, and password resets. Use this dashboard to verify that accounts are being administered correctly and that administration privileges for each type of account are restricted to the correct users and roles. A sudden increase in the number of accounts created, modified, or deleted can mean a rogue system or malicious behavior. A high number of account lockouts may indicate an attack.
Dashboard filters
Use the available dashboard filters to refine the results displayed on the dashboard panels. The filters do not apply to key security indicators.
| Filter by | Description | Action |
|---|---|---|
| Business Unit | A group or department classification for the identity. | Text field. Empty by default. Wildcard strings with an asterisk (*) |
| Category | Filter based on the categories to which the host belongs. For more information, see "Dashboard Filters" in the Installation and Configuration manual | Drop-down: select to filter by |
| Special Accounts | Restricts the view to events related to privileged access. An account that is known to have administrator or super-user access is considered privileged, such as root or administrator accounts. This list of accounts can be configured using Configure > Lists and Lookups > Default Accounts. | Drop-down: select to filter by |
| Time Range | Select the time range to represent. | Drop-down: select to filter by |
Dashboard Panels
| Panel | Description |
|---|---|
| Account Management Over Time | Displays all account management events over time. |
| Account Lockouts | Displays all account lockouts, including the number of authentication attempts per account. |
| Account Management by Source User | Tracks the total account management activity by source user and shows the source users with the most account management events. The source user is the user that performed the account management event, rather than the user that was affected by the event. For example, if user "Friday.Adams" creates an account "Martha.Washington", then "Friday.Adams" is the source user. This panel helps identify accounts that should not be managing other accounts and shows spikes in account management events, such as the deletion of a large number of accounts. |
| Top Account Management Events | The Top Account Management Events panel shows the most frequent management events in the specified time period. |
Troubleshooting
For information about troubleshooting, see "Troubleshooting Access dashboards" in this topic.
Default Account Activity dashboard
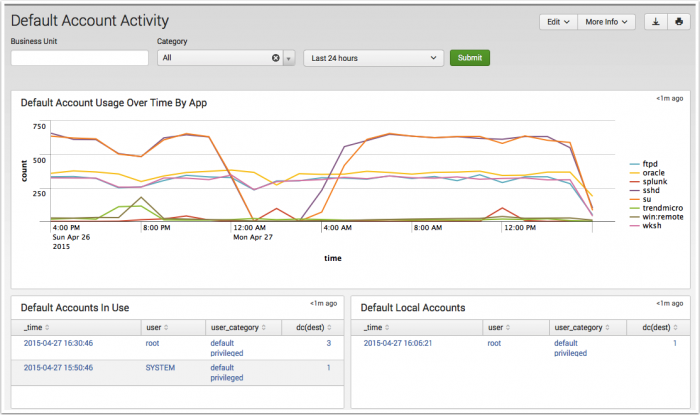
The Default Account Activity dashboard shows activity on "default accounts", that is, out-of-the-box accounts that are enabled by default on various systems, including network infrastructure devices, databases, and applications. Default accounts have well-known passwords and are often not disabled properly when the system is deployed.
In addition, there may be a need to monitor or investigate authorized use of a default account. Many security policies require that default accounts be disabled. When security policies allow the use of default accounts, it is important to make sure that the password has been changed from the default. Abnormal or deviant behavior can indicate security threats or policy violations. If the organization has a policy restricting default accounts, make sure to monitor this dashboard on a regular basis.
Dashboard filters
Use the available dashboard filters to refine the results displayed on the dashboard panels. The filters do not apply to key security indicators.
| Filter by | Description | Action |
|---|---|---|
| Business Unit | A group or department classification for the identity. | Text field. Empty by default. Wildcard strings with an asterisk (*) |
| Category | Filter based on the categories to which the host belongs. For more information, see "Dashboard Filters" in the Installation and Configuration manual | Drop-down: select to filter by |
| Time Range | Select the time range to represent. | Drop-down: select to filter by |
Dashboard panels
| Panel | Description |
|---|---|
| Default Account Usage by Time | Shows default account activity on all systems and applications within the infrastructure in the selected time frame. Accounts are shown by the number of successful login attempts and when the last attempt was made. Use this chart to identify spikes in default account login activity, which may indicate a security incident as well as to determine whether default account use is common (for example, a daily event) or rare. |
| Default Accounts in Use | Shows all default user accounts with a high number of login attempts on different hosts, including the last attempt made. Abnormal default user account activity that could indicate a security threat. Also helps ensure that default account behavior matches the security policy. |
| Default Local Accounts | Lists all default accounts that are active on the enterprise systems, including accounts "at rest". Any default accounts that are available are listed, regardless of whether the account was actually used. Only those accounts that were detected on a local system - for example, by examining the users list on a host - are included in this list. |
Troubleshooting
For information about troubleshooting, see "Troubleshooting Access dashboards" in this topic.
Troubleshooting Access dashboards
1. This dashboard references data from various data models. Without the applicable data, the dashboards will remain empty.
2. Use the Open in Search link available in the lower left corner of a dashboard view to perform a direct search against the data model. The New Search dashboard also exposes the search commands and objects used to populate the view.
3. Determine if any data required for a dashboard is available in the data model.
- a. Determine the data model objects used by a dashboard:
Dashboard Name Panel Title Data Model Data Model Object Access Center Access Over Time By Action Authentication Authentication.action Access Over Time By App Authentication.app Top Access By Source Authentication.src Top Access By Unique User Authentication.user,.src Access Search Authentication.action, .app, src, .dest, .user, src_user Access Tracker First Time Access - Last 7 days None. Calls access_tracker lookup Inactive Account Usage - Last 90 days Completely Inactive Accounts - Last 90 days Account Usage For Expired Identities - Last 7 days Authentication Authentication.dest Account Management Account Management Over Time Change Analysis All_Changes.Account_Management, .action Account Lockouts All_Changes.Account_Management, .result Account Management By Source User All_Changes.Account_Management, .src_user Top Account Management Events All_Changes.Account_Management, .action Default Account Activity Default Account Usage Over Time By App Authentication Authentication.Default_Authentication, .action, .app Default Accounts In Use Authentication.user_category, .dest, .user Default Local Accounts None. Calls useraccounts_tracker lookup
- b. Use the data model and data model object to search for events in the data model:
Action Search Expected Result Verify the data is normalized to the Common Information Model | datamodel data_model_name root_object_name search | table _time, sourcetype, root_object_name.* Example: | datamodel Network_Traffic All_Traffic search | dedup sourcetype | table _time, sourcetype, All_Traffic.*
Returns a list of sourcetypes and the data model objects and fields populated by that sourcetype.
4. Validate the data model is being accelerated.
- In the Splunk App for Enterprise Security, browse to Audit > Data Model Audit. Review the Acceleration Details panel for information about the data model acceleration status.
- Note: For more information about data model acceleration and the Enterprise Security App, see "Data models in the Enterprise Security app" in the Installation and Configuration Manual.
| Protocol Intelligence dashboards | Endpoint dashboards |
This documentation applies to the following versions of Splunk® Enterprise Security: 3.3.0, 3.3.1, 3.3.2, 3.3.3


 Download manual
Feedback submitted, thanks!