More Network dashboards
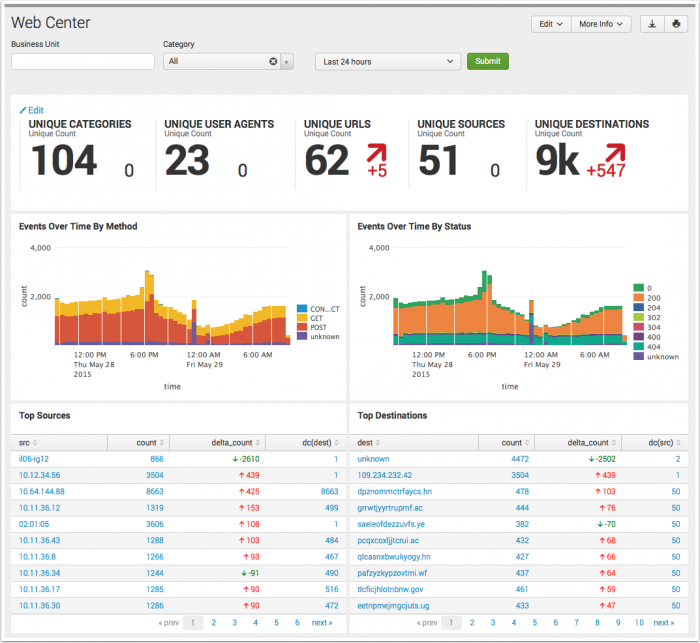
Web Center
Use the Web Center dashboard to profile web traffic events in your deployment. This dashboard reports on web traffic gathered by Splunk from proxy servers. It is useful for troubleshooting potential issues such as excessive bandwidth usage or proxies that are no longer serving content for proxy clients. The Web Center can also be used to profile the type of content that clients are requesting and how much bandwidth is being used by each client.
Use the filtering options at the top of the screen to limit which items are shown. Configure new data inputs through Splunk Settings or search for particular traffic events directly through Incident Review.
| Filter by | Description | Action |
|---|---|---|
| Business Unit | A group or department classification for the identity. | Text field. Empty by default. Wildcard strings with an asterisk (*) |
| Category | Filter based on the categories to which the host belongs. For more information, see "Dashboard Filters" in the Installation and Configuration manual | Drop-down: select to filter by |
| Time Range | Select the time range to represent. | Drop-down: select to filter by |
Dashboard Panels
| Panel | Description |
|---|---|
| Key Indicators | Displays the metrics relevant to the dashboard sources over the past 24 hours. Key indicators represent summary information and appear at the top of the dashboard. See "Key indicators" in this manual. |
| Events Over Time by Method | Shows the total number of proxy events over time, aggregated by Method: the HTTP method requested by the client (POST, GET, CONNECT, etc.) |
| Events Over Time by Status | Shows the total number of proxy events, aggregated by Status: the HTTP status of the response |
| Top Sources | Sources associated with the highest volume of network traffic. This is useful for identifying sources that are using an excessive amount of network traffic (for example, hosts doing file-sharing), or frequently-requested destinations generating large amounts of network traffic (for example, YouTube or Pandora). |
| Top Destinations | Destinations associated with the highest volume of network traffic. This is useful for identifying sources that are using an excessive amount of network traffic (for example, hosts doing file-sharing), or frequently-requested destinations generating large amounts of network traffic (for example, YouTube or Pandora). |
Troubleshooting
For information about troubleshooting, see "Troubleshooting Network dashboards" in this topic.
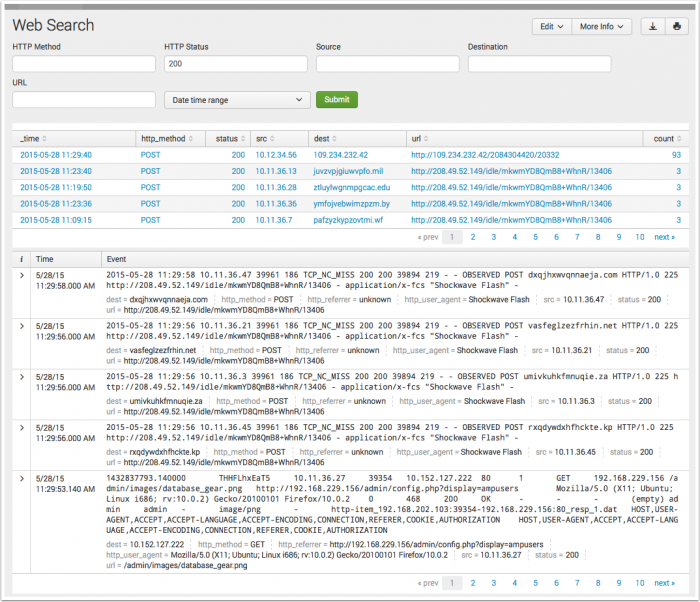
Web Search
The Web Search dashboard assists in searching for web events that are of interest based upon the criteria defined by the search filters. The dashboard is used in ad-hoc searching of web data, but is also the primary destination for drilldown searches used in the "'Web Search dashboard panels.
The Web Search dashboard displays no results by default unless it was opened in response to a drilldown action, or the user updates a filter, selects a time range, and chooses Submit.
| Filter by | Description | Action |
|---|---|---|
| HTTP Method | Filter based upon HTTP Method. | Text field. Empty by default. Wildcard strings with an asterisk (*) |
| HTTP Status | Filter based upon HTTP Status code. | Text field. Empty by default. Wildcard strings with an asterisk (*) |
| Source | Filter based upon source IP or name. | Text field. Empty by default. Wildcard strings with an asterisk (*) |
| Destination | Filter based upon destination IP or name. | Text field. Empty by default. Wildcard strings with an asterisk (*) |
| URL | Filter based upon URL details. | Text field. Empty by default. Wildcard strings with an asterisk (*) |
| Time Range | Select the time range to represent. | Drop-down: select to filter by |
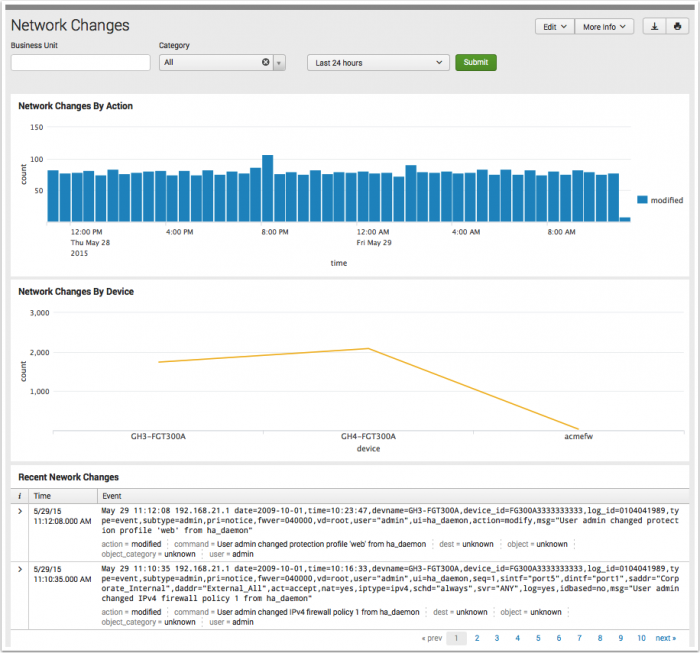
Network Changes
Use the Network Changes dashboard to track configuration changes to firewalls and other network devices in your environment. This dashboard helps to troubleshoot device problems; frequently, when firewalls or other devices go down, this is due to a recent configuration change on the device(s).
| Filter by | Description | Action |
|---|---|---|
| Business Unit | A group or department classification for the identity. | Text field. Empty by default. Wildcard strings with an asterisk (*) |
| Category | Filter based on the categories to which the host belongs. For more information, see "Dashboard Filters" in the Installation and Configuration manual | Drop-down: select to filter by |
| Time Range | Select the time range to represent. | Drop-down: select to filter by |
Dashboard Panels
| Panel | Description |
|---|---|
| Network Changes by Action | Shows all changes to the devices by the type of change; that is, whether a device was added, deleted, modified, or changed. The drilldown redirects the page to the "New Search" dashboard and searches on the selected action and time range. |
| Network Changes by Device | Shows all devices that have been changed as well as the number of the changes, sorted by the devices with the highest number of changes. The drilldown redirects the page to the "New Search" dashboard and searches on the selected device and time range. |
| Recent Network Changes | Shows a table of the most recent changes to network devices in the last day. |
Troubleshooting Network Dashboards
1. This dashboard references data from various data models. Without the applicable data, the dashboards will remain empty.
2. Use the Open in Search link available in the lower left corner of a dashboard view to perform a direct search against the data model. The New Search dashboard also exposes the search commands and objects used to populate the view.
3. Determine if any data required for a dashboard is available in the data model.
- a. Determine the data model objects used by a dashboard:
Dashboard Name Panel Title Data Model Data Model Object Web Center Events Over Time By Method Web Web.http_method Events Over Time By Status Web.status Top Sources Web.dest, .src Top Destinations Web.dest, .src Web Search Web.http_method, .status, .src, .dest, .url Network Changes Network Changes By Action Change Analysis All_Changes.Network_Changes, .action Network Changes By Device All_Changes.Network_Changes, .dvc
- b. Use the data model and data model object to search for events in the data model:
Action Search Expected Result Verify the data is normalized to the Common Information Model | datamodel data_model_name root_object_name search | table _time, sourcetype, root_object_name.* Example: | datamodel Network_Traffic All_Traffic search | dedup sourcetype | table _time, sourcetype, All_Traffic.*
Returns a list of sourcetypes and the data model objects and fields populated by that sourcetype.
4. Validate the data model is being accelerated.
- In the Splunk App for Enterprise Security, browse to Audit > Data Model Audit. Review the Acceleration Details panel for information about the data model acceleration status.
- Note: For more information about data model acceleration and the Enterprise Security App, see "Data models in the Enterprise Security app" in the Installation and Configuration Manual.
| Network dashboards | Identity dashboards |
This documentation applies to the following versions of Splunk® Enterprise Security: 3.2, 3.2.1, 3.2.2, 3.3.0, 3.3.1, 3.3.2, 3.3.3


 Download manual
Feedback submitted, thanks!