Review an investigation in Splunk Enterprise Security
Revisit past investigations, or view a current investigation by clicking the title from the investigation bar or from the Investigations page. Users with the capability to manage all investigations can view all investigations. Only collaborators on an investigation with write permissions can edit an investigation. See Manage access to investigations in Administer Splunk Enterprise Security.
You can also review the summary of an investigation. See Review the summary of an investigation in Splunk Enterprise Security.
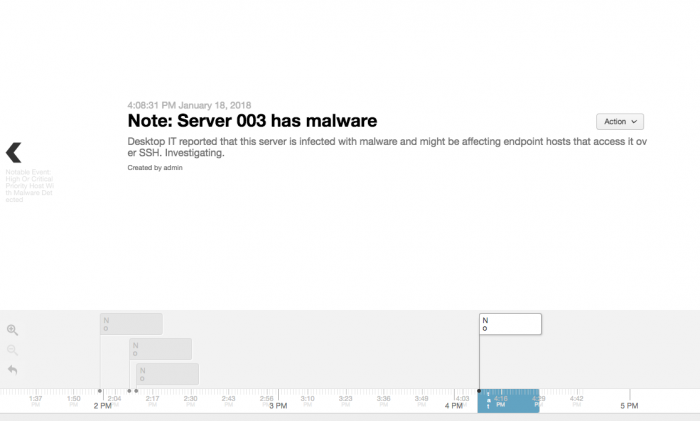
Review an entry's investigation for training or research purposes. Click an entry on an investigation to see all details associated with it.
- For notes with file attachments, click the file name to download the file attachment.
- For notable events, click View on Incident Review to open the Incident Review dashboard filtered on that specific notable event.
- For action history entries, you can repeat the previously-performed action. For a search action history entry, click the search string to open it in search. For a dashboard action history entry, click the dashboard name to view the dashboard.
Gain insight into an attack or investigation by viewing the entire investigation timeline or view only part of it by expanding or contracting the timeline.
Click the timeline to move it and scan the entries. View a chronological list of all timeline entries by clicking the list icon, or refine your view of the timeline using filters. You can filter by type or use the Filter box to filter by title.
Review the status history of an investigation
You can review the status history of an investigation visually on the investigation timeline. The timeline changes color to reflect changes in status assignments. The color does not relate directly to the status of the investigation, and is automatically assigned. The colors cannot be changed, customized, or removed.
| Collaborate on an investigation in | Share or print an investigation in Splunk Enterprise Security |
This documentation applies to the following versions of Splunk® Enterprise Security: 5.0.0, 5.0.1, 5.1.0, 5.1.1, 5.2.0, 5.2.1, 5.2.2, 5.3.0, 5.3.1, 6.0.0, 6.0.1, 6.0.2, 6.1.0, 6.1.1, 6.2.0, 6.3.0 Cloud only, 6.4.0, 6.4.1, 6.5.0 Cloud only, 6.5.1 Cloud only, 6.6.0, 6.6.2

 Download manual
Feedback submitted, thanks!