Take action on a notable event on Incident Review in Splunk Enterprise Security
From Incident Review, you can suppress or share a notable event, add an event or multiple events to an investigation, analyze the risk that an asset or identity poses to your environment, or investigate a field in more detail on another dashboard.
Run an adaptive response action
Based on the details in a notable event, you may want to run a response action to gather more information, take an action in another system, send information to another system, modify a risk score, or something else.
Prerequisite
Some custom adaptive response actions use the credential store to connect to a third-party system or app. To run these actions successfully, you must have the list_storage_passwords capability.
Steps
- From a notable event, select the arrow to expand the Actions column.
- Click Run Adaptive Response Actions.
- Click Add New Response Action and select an adaptive response action from the list. You can use the category filter or search to reduce the number of actions that you can select.
- Fill out the form fields for the response action. Use the field name to specify a field, rather than the name that shows on Incident Review.
For example, type "src" instead of "Source" to specify the source field for an action. - Click Run.
You can check the status of the response action in the notable event details. View the original field names of fields displayed on Incident Review on the Incident Review - Event Attributes panel of the Incident Review Settings dashboard.
Adblock extensions in your browser can cause response actions to fail. Add the host name of your Splunk Enterprise Security host to the site whitelist for the adblock extension.
See Included adaptive response actions with for more about the different adaptive response actions included with .
You can share a notable event with another analyst using a short ID or a link.
- From the event actions, click Share Notable Event.
Enterprise Security creates a short ID for the notable event and displays a link that you can copy to share with an analyst. You can also save the link as a bookmark by dragging the bookmark icon to the bookmarks toolbar in your web browser.
You cannot share a notable event from the Search dashboard.
Analyze risk of an asset or identity
You can analyze the risk that an asset or identity poses to your environment in the Incident Review dashboard.
- Open the event details.
- Review the risk score next to asset or identity fields such as src or host.
- Click the risk score to open the Risk Analysis dashboard filtered on the asset or identity.
Not all assets and identities display a risk score. Risk scores that display for an asset or identity in Incident Review may not match the risk score on the Risk Analysis dashboard for that risk object. For more information, see How risk scores display in Incident Review in Administer Splunk Enterprise Security.
Add a notable event to an investigation
Investigate notable events that could be a part of a security incident by adding them to an investigation.
Add a notable event to an existing investigation
- Add one or more notable events to an investigation.
- Add a single notable event by selecting Add Event to Investigation from the Event Actions.
- Add multiple notable events by selecting the check boxes next to the notable events and click Add Selected to Investigation.
- Select an investigation to add the notable events to. If you selected an investigation in the investigation bar, that investigation is selected by default.
- Click Save.
- After the event or events are successfully added to the investigation, click Close.
Add a notable event to a new investigation
- Select one or several notable events and click Add Selected to Investigation.
- Click Create Investigation to start a new investigation.
- Type a title for the investigation.
- (Optional) Change the default status.
- (Optional) Type a description.
- Click Save to save the investigation and add the notable event or notable events to the investigation. Clicking Cancel does not add the selected notable events, but the new investigation is still created. You can click Start Investigation to add the notable events to the investigation and open the investigation.
- After the event or events are successfully added to the investigation, click Close or click Open <Investigation name> to open the investigation.
See Investigations in Splunk Enterprise Security for more.
After you add a notable event to an investigation, you can filter by notable events on that investigation on the Incident Review dashboard using the Associations filter, or view the investigation in the notable event details.
When adding a sequenced event to an investigation, the contributing notable events will be added instead. For more information about creating sequenced events, see Create sequence templates in Splunk Enterprise Security.
While you are investigating an event, you can get notified about incoming notable events that are related to the investigation via the investigation toolbar. The investigation toolbar is available on all ES dashboards. Settings enabled for an investigation in one dashboard are carried over to that investigation in other dashboards automatically.
Enable the related notable event livefeed.
- Click the bell icon on the investigation toolbar at the bottom-right side of the Incident Review page, the Investigation Workbench, or any ES dashboard.
- Toggle the switch to enable notification for the livefeed.
- Click Close.
While you are investigating, you will get a visual notification if any related notable events occur. The bell icon color will change to orange within five minutes of the occurrence.
Acknowledge the livefeed notification or add notable events to the investigation.
- Hover over the orange bell icon on the investigation bar at the bottom-right side of the Incident Review page or the Investigation Workbench. This tells you how many notable events are available.
- Click the orange bell icon.
- The related notable event livefeed window appears, containing events from the last 48 hours.
- (Optional) Click + to add a notable event to the investigation.
- Click Mark All as Seen to clear the livefeed when you no longer want to see the related events. This will also reset the notification, so that these no longer count against the notification number mentioned in step 1.
- Click Close.
Investigate a field in more detail
Take action on a specific field, such as host, src, src_ip, dest, or dest_ip. Different actions are available to take depending on the field you select.
- Tag fields by selecting Edit tags.
- Investigate an asset by selecting Asset Investigator to open the Asset Investigator dashboard filtered on the asset.
- Search for access-related events for a specific destination IP address by selecting Access Search (as destination).
- Investigate a domain by selecting Domain Dossier.
- Find other notable events with matching malware signatures by selecting Notable Event Search.
Suppress a notable event
Hide notable events from the Incident Review dashboard by suppressing them. Creating a notable event suppression does not change the counts of notable events on the posture or auditing dashboards. See Create and manage notable event suppressions for more details.
- Select a notable event on the Incident Review dashboard.
- From the Actions menu, select Suppress Notable Events.
- Type a Suppression Name.
For example, Excessive_Failed_Logins.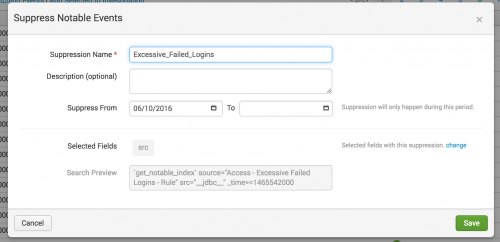
- (Optional) Provide a reason for the suppression using the Description field.
- (Optional) Set a date range. After the time limit ends, the suppression filter expires and stops hiding events.
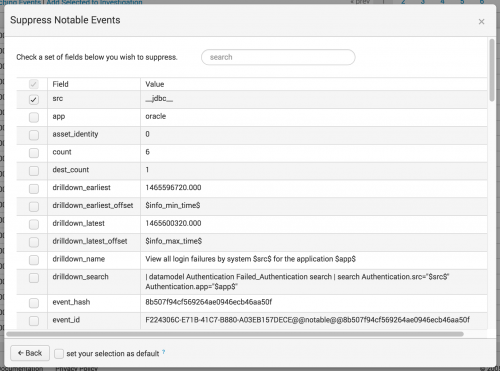
- Review the Selected Fields to validate the fields that you want to suppress notable events from. For example, the
srcfield - (Optional) Click change to modify the notable event fields used for the suppression.
- Save changes.


This example notable event suppression hides all notable events created after June 10, 2016 that contain a src=_jdbc_ field from Incident Review.
You cannot suppress notable events from the Search dashboard.
| Investigate a notable on Incident Review in Splunk Enterprise Security | Included adaptive response actions with |
This documentation applies to the following versions of Splunk® Enterprise Security: 5.2.0, 5.2.1, 5.2.2, 5.3.0, 5.3.1, 6.0.0, 6.0.1, 6.0.2, 6.1.0, 6.1.1
Feedback submitted, thanks!