Using Enterprise Security to find Malware
Enterprise Security provides statistics and interesting events on security domain specific dashboards. Using the dashboards together, you can build a workflow for investigating threats by reviewing the results, isolating the events that require attention, and using the contextual information provided to drill down into the issue.
Prerequisites
- Verify that a Splunk platform instance with Splunk Enterprise Security is installed and configured.
- Verify that logs from an IDS/IPS tool, web proxy software or hardware, and/or an endpoint security product are indexed on a Splunk platform instance.
The Security Posture dashboard
Begin by reviewing the Security Posture dashboard. The dashboard represents a summary of all notable event activity over the last 24 hours. A notable event is the result of a security-oriented correlation search that scans the indexed logs until a match is found. When a notable event is created, it represents a potential issue or threat requiring a review and, depending upon the outcome of the review, an investigation.

On any given day, there might be tens or hundreds of notable events represented on the Security Posture dashboard. Use the Notable Events By Urgency panel to determine which issue needs your immediate attention.
In the Notable Events Over Time panel, you see a spike in activity labeled "endpoint." The endpoint domain represents host based security, so you know there was a large spike in suspicious activity on the network hosts.
In the Top Notable Events panel, you see the count of notable events sorted by the correlation search name. The panel shows that the number of High Or Critical Priority Host With Malware Detected notable events had a sudden spike. To drill down into those numbers, select the peak count on the sparkline to open another browser window and drill down to the Incident Review dashboard.
Working in Incident Review
Use the Incident Review dashboard to find, assign, analyze, and update notable events. Because the link to Incident Review was initiated from another dashboard panel, the Incident Review dashboard opens with a search for High Or Critical Priority Host With Malware Detected notable events and scoped to a narrow timeframe.
Prioritize the task
The search for High Or Critical Priority Host With Malware Detected ranges over several Urgency levels. The event urgency is calculated based on the priority assigned to a host or asset and the severity assigned to the correlation search.

- Start the investigation by looking at the notable event labeled Critical.
- Remove other notable events from the view by deselecting all other Urgency levels until only Critical remains.
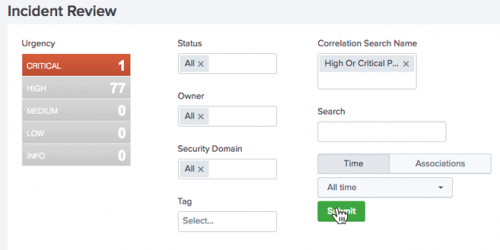
- Click Submit.

The Incident Review dashboard displays only the Critical notable event that was created for a High Or Critical Priority Host With Malware Detected.
Task assignment
Assigning notable events begins a record of activity that you can use for notes and time tracking, and lets other analysts know that an issue is being investigated.
To assign the notable event to your user account:
- Use the check box to select the first notable event.
- Click the Edit all matching events link on the top left of the table view.
- Change the Status field to In Progress, and assign your user as the Owner.
- Update the Comment field as required by your company security policy.
- Click Save changes to return to the Incident Review dashboard.
Notable event review
The Description field is a summary of the conditions a correlation search must find for you to create a notable event.
- Click the arrow next to a notable event to expand the view and display the details of the notable event.
- Review the information provided with the notable event.
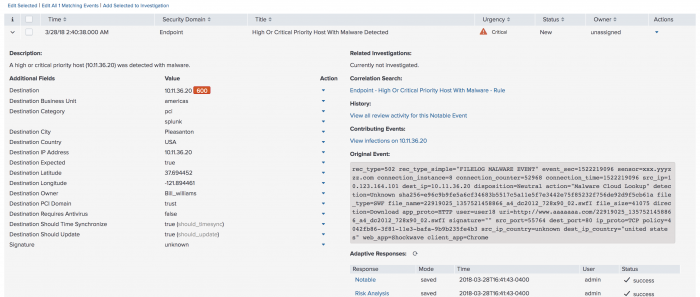
Each notable event has a selection of fields that provide contextual information about the issue. The fields are populated with data correlated from the logs of one or more data sources and asset and identities collections. - Review several fields for history about the host or hints of activity. The Urgency assigned to this notable event was partially calculated from the priority assigned to the host.
- Begin the investigation into the host by investigating the Destination IP Address. Click the arrow next to the Destination IP Address field to initiate a field action. A field action initiates a new search on another dashboard in Enterprise Security, using the selected field as a filter. This technique helps you to maintain context while opening multiple dashboards or using views during an investigation.
- In the field action menu, select Asset Investigator.
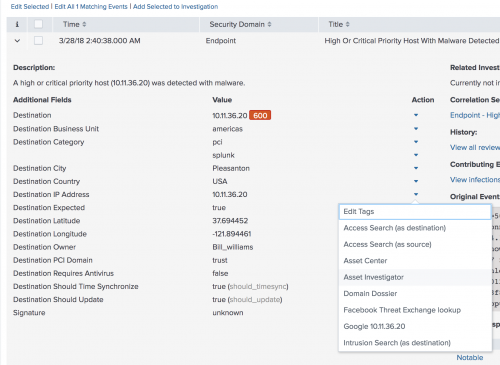


A new browser window opens to the Asset Investigator dashboard and begins a search on the selected Destination IP Address.
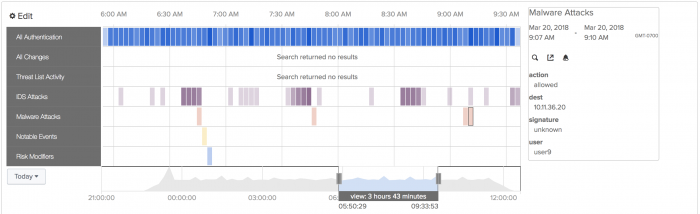
Working in Asset Investigator
The Asset Investigator dashboard displays data about one asset or host collected and grouped by a common threat category. Each category is represented as a named row of data called a swim lane.

Each swim lane has a collection of data points called candlesticks. The event count within a candlestick is represented through a heat map. The brighter the color, the higher the event count.
If you see too many events in one category, use the time sliders to focus the view down to the time frame where the notable event was triggered. In this example, the time sliders are moved to focus on a group of Malware Attacks.

Find the event
At this point, you can follow any number of malware events related to this host. Use the Malware Attacks swim lane to select a candlestick and review the common fields using the Event Panel.
- In the Malware Attacks swim lane, select a candle stick.
- In the Event Panel find an event marked with a signature of unknown.
- Click the Go to Search icon to open another browser window to drill down and search on the selected Destination IP Address.


Drill down to log events
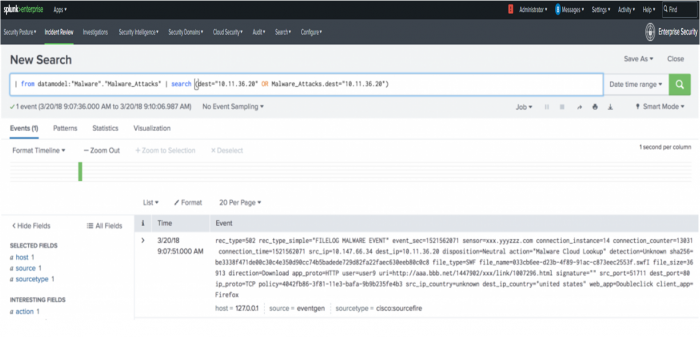
Review the New Search dashboard. The search dashboard is still in Enterprise Security context, as marked by App: Enterprise Security in the top left corner. This mode ensures that the field values, aliases, and other field categories supplied with ES will apply when raw log events are searched from this dashboard.
Examine the drilldown search in the search bar. The process begins by identifying the datamodel | datamodel ("Malware","Malware_Attacks") before calling the normalized host value for the Malware data model | search (dest="x.x.x.x" OR "Malware_Attacks.dest="x.x.x.x"). A datamodel search command searches the indexed data over the time frame, filters the results through the malware data model constraints, and returns any matches.
Enterprise Security does not use accelerated data models for drilldown searches, so it is important to set a time range for faster results. The Malware_Attacks.dest represents the dest_ip field reference in the malware data model.
Identify relevant fields
You can see that the raw event has a lot of information to process. Let's begin by looking at common fields, such as dest_ip, source, and sourcetype. Reviewing these fields, you see that the dest_ip references an internal IP address range. Searching your network device inventory system might tell you what that host or dest_ip represents.
The source and sourcetype identify the events as sourcefire data. After confirming the dest_ip represents a proxy server device, you know that the src_ip field represents other hosts on the internal network accessing data through the proxy.

This event also contains client_app and uri fields. These fields represent traffic from a web browser to a site requesting a download. Let's review which fields in the source logs are relevant, and why.
| Field | Description |
|---|---|
src_ip |
Represents internal network hosts. |
dest_ip |
Another internal host that was discovered to be a proxy. |
uri |
A record of what is being requested by the hosts. |
client_app |
The browser used. |
You know that the Critical notable event represents an unknown malware signature being passed through the proxy server into your network. As you progress through the investigation and followed data flows and requests, you created a list of the key fields relevant to the threat. Because a number of malware downloads are reported by the proxy, expand the search to find the internal hosts that are responsible.
Review a broader timespan of events
Broaden the search by widening the time range and search again.
- Select the Date time range button.
- Lower the Earliest time field to an earlier time (for example,
02:00:00.000). - Raise the Latest field to a later time (for example,
10:00:00.000). - Click Apply to keep the changes.
- Click Search.
The search page now shows multiple similar events that passed through the proxy.

The search view displays many more events, but may be impractical for summarizing the data by important fields. Changing the search to a table view lets you retain the important fields and reduce the visual clutter. A table can also provide a reference because the results can be exported for reporting.
To view a table of the events sorted by relevant fields, use the search bar to add | table dest src url to the end of the existing search string and click search again.

On the page of results, you see a number of common download requests. The .swfl file represents shockwave flash content. Because shockwave is a commonly exploited framework used to run malicious code or exploits, review the relevant fields that describe a shockwave download.
Find an exploited host
On the table of results, select a src field in an event referencing a downloaded shockwave file.
- Click the
srcfield. - Select New search.
A new browser window opens to a search dashboard and begins to search on the selectedsrcfield over the time range.
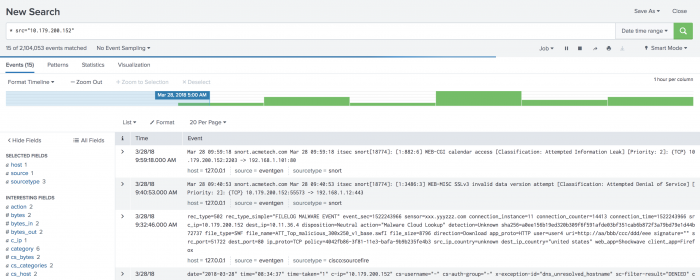
From the results, you can see additional alerts about this host from other log sources, implying that the specificsrcis being targeted with multiple forms of attacks. There is a chance that this host has downloaded an exploit from an Internet domain. - Examine the
urlandfile_namefields for the host.- Review the data in a table format to give you a view of the important events.
- Use the search bar to add
| table url file_nameto the end of the existing search string and select search.
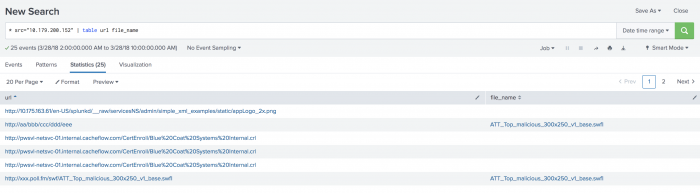
- Sort the table by selecting the
urlfield.


As you review the results, you can see that a number of executable files were downloaded from the same domains.
At this point, quarantine the infected host based upon the data collected. More information is contained in the proxy logs, such as the domain being used to download the suspicious files. Digging deeper into those logs can provide information to use in active remediation.
Find additional affected hosts
On the table of results, select a url field in an event that references a suspicious domain.
- Click the
urlfield. - Click the icon next to New search.
A new browser window opens to a search dashboard and begins searching on the selectedurlfield over the time range.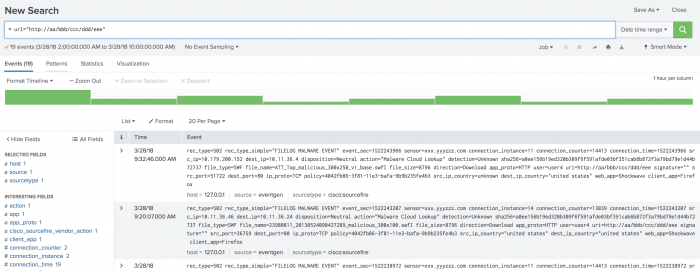

Widen the time range to broaden the search
- Click Date time range.
- Select the Last 24 hours option and click Search.
You can see that the total count of events reaching out to this domain over the last 24 hours is high. - Review the
srcfield on the field picker to identify a count of the unique hosts attempting a connection to this domain. A number of hosts will require active scanning for malware. A report of all hosts receiving downloads from this domain is a useful resource.
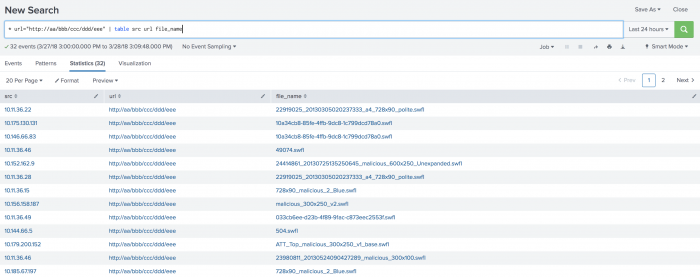
Create reports of the results
Review the data in a table format.
- Use the search bar to add
| table src url file_nameto the end of the existing search string. - Click Search.
The results show a list of potentially infected hosts including suspicious file names that can be delivered to the endpoint administrator for immediate action.
You can export the results to place into a report or an email attachment. - Click the Export button.
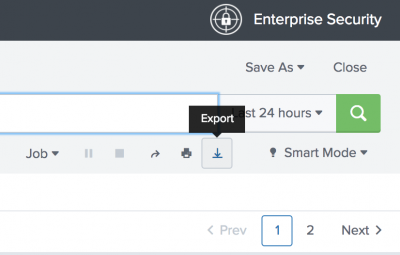
- Update the File Name field and save the results in a
.csvformat. - Click Export to download the results.
- (Optional) Click Save As and select Report to save the report.
- Fill in the required fields, and write a summary of the report for the Description field.
- Click Save to write the report to the search head. The report is private, and available only to the creator by default.


Update the notable event
Before you perform any additional analysis, update the notable event on the Incident Review dashboard. Record any objects or reports that are created, and other actions required to process and close the notable event.
Use the report results for reference and investigation. You can deliver the .csv of hosts and file names to the team monitoring the endpoints.
Malware discovery summary
Using the data provided by the proxy server, Splunk Enterprise Security created notable events when hosts requested downloads from a suspicious domain. The notable events provided a starting point for investigation and included the most relevant fields to examine. By sorting the data and pivoting on those fields, an analyst generated a collection of reports that exposed the internal hosts involved, domains that might be blocked, and common file names that the malware runs as. As the remediation begins, the investigator has all of the critical information to act on the threat.
| Overview | Use DNS data to identify malware patient zero |
This documentation applies to the following versions of Splunk® Enterprise Security: 5.1.0, 5.1.1, 5.2.0, 5.2.1, 5.2.2, 5.3.0, 5.3.1, 6.0.0, 6.0.1, 6.0.2, 6.1.0, 6.1.1, 6.2.0, 6.3.0 Cloud only, 6.4.0, 6.4.1, 6.5.0 Cloud only, 6.5.1 Cloud only, 6.6.0, 6.6.2
Feedback submitted, thanks!