Configure Windows event logging to ensure the proper events are logged
This topic applies only to customers on the Splunk Cloud platform.
Configure Windows event logging to make sure that the events required for behavioral analytics service detections are logged.
Behavioral analytics service detections require 4688, 4103, and 4104 events in order to generate anomalies. See Supported data sources in behavioral analytics service for a complete list of supported Windows events.
Turn on command line process logging for 4688 events
Microsoft Windows 4688 events contain audit information for command line processes. To turn on 4688 events to be logged, perform the following tasks:
- Turn on Audit Process Creation.
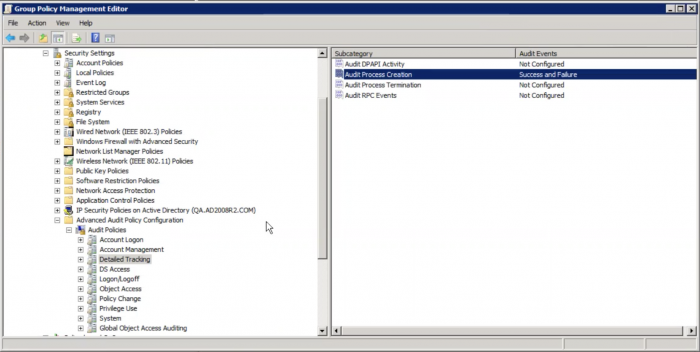
- Go to the policy editor on your local Windows machine. The policy is located at Computer Configuration > Policies > Windows Settings > Security Settings > Advanced Audit Configuration > Detailed Tracking.
- Double-click Audit Process Creation.
- Select both the Success and Failure checkboxes in the Audit Process Creation Properties window.
- Click OK. You can verify your setting if both Success and Failure appear in the Audit Events column, as shown in the following image:
- Turn on Include command line in process creation events.
- Go to Computer Configuration > Policies > Administrative Templates > System > Audit Process Creation.
- Double-click Include command line in process creation events.
- Click the Activate / turn on checkbox to turn on the command line logging in process creation events.
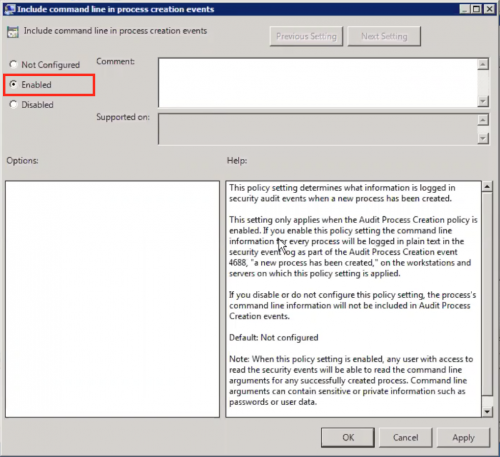
- Click Apply.
- Click OK to dismiss the window.


If you are using automation software, such as Ansible, for remote configurations, use the following script to turn on command line process logging:
- name: Enable Command Line Audit for Windows Sec. Events 4688
  ignore_errors: yes
  when: win_4688_cmd_line == "1"
  win_regedit:
    key: "HKLM:\\Software\\Microsoft\\Windows\\CurrentVersion\\Policies\\System\\Audit"
    value: ProcessCreationIncludeCmdLine_Enabled
    datatype: dword
    data: 1
- name: Enable New Process Creation. Events 4688
  ignore_errors: yes
  when: win_4688_cmd_line == "1"
  win_audit_policy_system:
    subcategory: Process Creation
    audit_type: success, failure
See "Command line process auditing" in the Microsoft documentation for more information.
Turn on PowerShell logging for 4103 and 4104 events
PowerShell provides access to Windows API calls that attackers can exploit to gain elevated access to the system, avoiding antivirus and other security controls in the process. PowerShell is also internally utilized by popular hacking tools.
Perform the following tasks to properly turn on PowerShell logging:
- On your local Windows system, navigate to Administrative Templates > Windows Components > Windows PowerShell.
- Double-click Turn on Script Execution.
- Click the Activated / Turned on checkbox.
- Select an execution policy from the drop-down list in the Execution Policy field. In the following image, the Allow all scripts policy is selected.
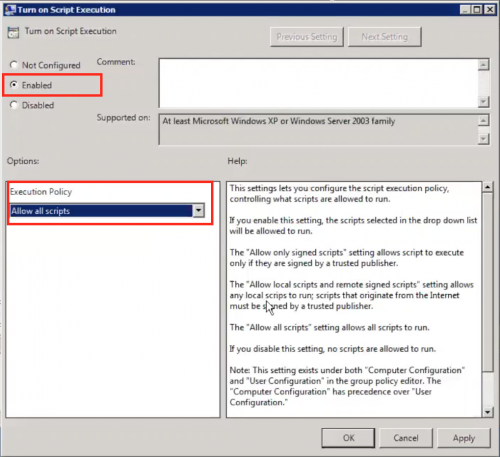
- Click Apply.
- Click OK to dismiss the window.
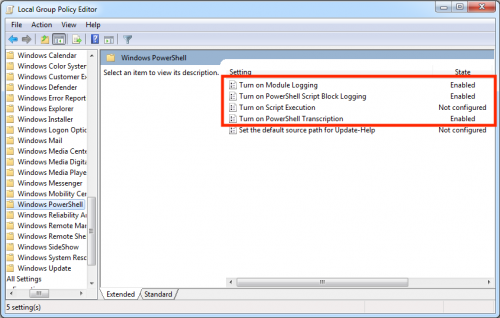
- Repeat the process and also turn on Turn on Module Logging, Turn on PowerShell Script Block Logging, and Turn on PowerShell Transcription. The following image shows the additional options:


If you are using automation software, such as Ansible, for remote configurations, use the following script to turn on PowerShell logging:
- name: Enable Windows Scriptblock Logging
  ignore_errors: yes
  win_regedit:
    key: "HKLM:\\Software\\Policies\\Microsoft\\Windows\\PowerShell\\ScriptBlockLogging"
    value: EnableScriptBlockLogging
    datatype: dword
    data: 1
- name: Enable Windows Scriptblock Logging
  ignore_errors: yes
  win_regedit:
    key: "HKLM:\\Software\\Policies\\Microsoft\\Windows\\PowerShell\\ScriptBlockLogging"
    value: EnableScriptBlockInvocationLogging
    datatype: dword
    data: 1
- name: restart machine
  win_reboot:
See "About Logging Windows" in the Microsoft documentation for more information.
| Supported data sources in behavioral analytics service | Supported detections in behavioral analytics service |
This documentation applies to the following versions of Splunk® Enterprise Security: 7.1.0, 7.1.1, 7.1.2, 7.2.0, 7.3.0, 7.3.1, 7.3.2, 7.3.3
Feedback submitted, thanks!