Add details to an investigation in Splunk Enterprise Security
As an analyst working on an investigation, add details and evidence to your investigation by adding events, actions, and notes. While you conduct your investigation using , you can add notable events or Splunk events that add insight to the investigation. Add searches, suppression filters, and dashboard views to the investigation from your action history. Record important investigation steps that you take, such as phone, email, or chat conversations as notes on the investigation. You can use notes to add relevant information like links to online press coverage, tweets, or upload screenshots and files.
Run a quick search from the investigation bar
Run a search without opening the search dashboard by clicking Quick Search ![]() on the investigation bar. The investigation bar is found at the bottom-right side of the Incident Review page or the Investigation Workbench.
on the investigation bar. The investigation bar is found at the bottom-right side of the Incident Review page or the Investigation Workbench.
- Add the search to the investigation in the investigation bar by clicking Add to Investigation.
- Use the Event Actions to add specific events in the search results to an investigation.
- To save the search results at investigation time, click Export to export the search results as a CSV file. Add the search results as an attachment to a note on the investigation.
- Click Open in Search to view the search results on the Search dashboard.
- Enlarge or shrink your view of the search results by clicking and dragging the corner of the window. Double click to expand the search view to cover most of your screen, or double click again to shrink it.
Add a notable event to an investigation
You can add a notable event to an investigation from the Incident Review dashboard. See Add a notable event to an investigation.
If the status of a notable event changes, or if an adaptive response action is run from the notable event, the investigation is updated with that information.
Add a Splunk event to an investigation
Add an event from the Splunk search page to an investigation. You can only add an event to an investigation from the search page in the Splunk Enterprise Security context.
- Expand the event details to see the Event Actions menu and other information.
- Click Event Actions and select Add to Investigation.
- A dialog box opens.
- Select an assignee.
If you have the manage_all_investigations capability, you can select User to see investigations where you are a collaborator or you can select All to see all the investigations in the system. If you don't have manage_all_investigations, then the assignee dropdown menu does not appear. - Select from existing investigations, or create one.
If you have the manage_all_investigations capability, and All selected as an assignee, you can add events to investigations where you are not a collaborator. This is used, for example, when a senior analyst is triaging and assigning events to the investigations of junior analysts.
- Select an assignee.
- Click Save.
See Capabilities specific to Splunk Enterprise Security in the Installation and Upgrade Manual.
Add an entry from your action history to an investigation
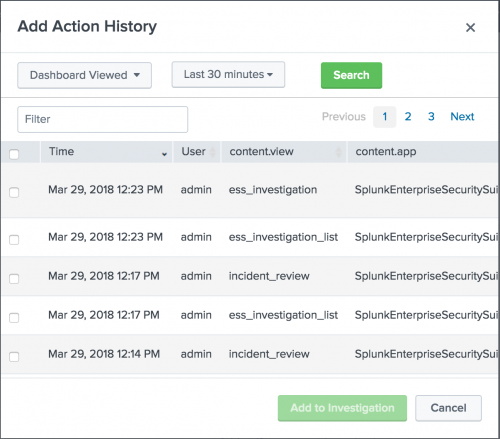
The action history stores a history of the actions that you have performed in , such as searches that you have run, dashboards you have viewed, and per-panel filtering actions that you have performed.
Add an entry to an investigation from your action history with the investigation bar. Search for specific types of action history items over time to find the action history items that you want to add to your investigation.
- From the investigation bar, click the
 icon.
icon. - Select an action history type and optionally change the time range.
- Click Search to retrieve a list of action history items.
- Find the actions that you want to add to the investigation. For example, view the dashboards that you viewed to add them to your investigation.

- The actions that you've taken display in the action history dialog box. You can only add actions from your own action history.
- Locate the action you want to add and select the check box next to the action or actions that you want to add to the investigation timeline.
- Click Add to Investigation.
The actions are added to the investigation that you are viewing or that is selected in the investigation bar.
See Refer to your action history.
Add a note to an investigation
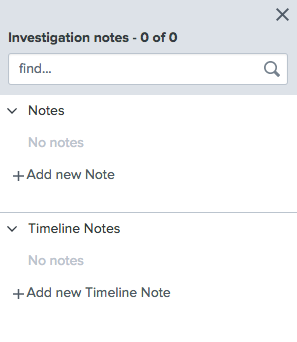
Add a note to an investigation to record investigation details or add attachments. You can add a note from dashboards in .
- From the investigation bar, click the
 icon.
icon. - In the investigation notes window, click Add new Note or Add new Timeline Note.

Timeline notes show up in the timeline slide view, while standard notes do not. - Type a title for the note.
For example, "Phone conversation with police." - Select a date and time. The default is the current date and time.
For example, select the time of the phone call. - (Optional) Click the check box to show or hide the note on the timeline.
- (Optional) Type a description.
For example, a note to record a phone conversation might include the description: Called the police. Spoke with Detective Reggie Martin. Discussed an employee stealing identities from other employees. - (Optional): Attach a file to the note.
- In the attachments section, drag the file onto the note or click browse to find the file.
- Select a file to add from your computer.
The maximum file size is 4 MB. You can add multiple files to a note. The first file you add to the note previews on the investigation timeline. - If the filename contains unsupported characters, click the Replace not supported characters with '-' and then click Change.
Alternately, you can remove and replace the unsupported characters manually.
- Click Add to Investigation to add the note to the open investigation.
| Investigate a potential security incident on the investigation workbench in Splunk Enterprise Security | Make changes to an investigation in Splunk Enterprise Security |
This documentation applies to the following versions of Splunk® Enterprise Security: 7.0.1, 7.0.2, 7.1.0, 7.1.1, 7.1.2, 7.2.0, 7.3.0, 7.3.1, 7.3.2, 7.3.3
 Download manual
Feedback submitted, thanks!