Customize Incident Review in Splunk Enterprise Security
The Incident Review page on the Splunk Enterprise Security app allows customizations to filter notables by fields. Additionally, you can create, save, share, edit, and delete saved views of these filters so that you can customize the display of notables within the context of your investigations. You can also configure a specific frequency to refresh notables on the Incident Review page so that notables get automatically updated and new notables can be addressed in a timely manner.
Turn off the enhanced workflow on the Incident Review page
In Splunk Enterprise Security version 7.2 and higher, you can select the table headers to apply filters and create saved views. in Splunk ES v7.2.0 and lower, the enhanced workflow on the Incident Review page is turned off by default.
In Splunk Enterprise Security version 7.3.0 and higher, enhanced workflows to use shared views, saved views, table filters, and table columns on the Incident Review page is turned on by default. You can turn off the enhanced workflow if required.
Follow these steps to turn off the enhanced workflows on the Incident Review page in Splunk Enterprise Security version 7.3.0 and higher:
- In the Splunk Enterprise Security app, select Configure.
- Select General and then select General Settings.
- Go to Enhanced Incident Review workflow panel.
- Select Turn off.
Turning off the enhanced workflow capability on the Incident Review page, deletes all existing saved views.
Filter notables by field in Incident Review
Filtering by table columns on the Incident Review page lets you view only those notable events that match a particular value of any field. To display the filters on the Incident Review page, select Show Filters. Add the fields that you want to use to group the notables such as Unassigned, Critical, and so on in the Search notables filter. For example, a threat engineer might be specifically tasked with triaging endpoint attack notables that have specific information about the attack in each notable. In such cases, the ability to sort and filter notables based on specific fields on the Incident Review table is useful for triaging threat. For more information, see Customize table settings to display notable fields
Using tokenized fields to search in table column filters might not provide the expected search results. However, you can use tokenized fields to filter notables in the search field on the Incident Review page.
Saved views to reuse specific filter groups
Saving specific views of filters and columns on the Incident Review page lets you view the values of the relevant fields for specific investigations and triage them appropriately. For example, a cyber operations manager can create default saved views for various SOC teams in Splunk Enterprise Security. Saving specific default views provides a starting point for analysts to triage notables and can help them identify what to look for when they have not defined their own customized saved views. For more information, see Create saved views to reuse specific filter groups.
To help ES analysts with their workflows, you can add a link in the app navigation that loads a version of Incident Review with filters applied. See Add a link to a filtered view of Incident Review.
Share saved views with analysts to improve investigation workflows and customize notable displays on Incident Review. Switching contexts between shared saved views lets you select between views and filter notables easily based on their relevance to the analyst. Such tasks can vary between general alert triage, phishing response, fraud detection, anomalous user behavior detection, or threat detection.
For more information, see Manage saved views to view notables
Access controls to manage saved views
As a Splunk Enterprise Security administrator, you can provide additional customization and filtering capabilities to analysts so that they can easily view and interact with the notables in their queue on the Incident Review page. You must have the edit_filter_sets capability to assign, create, or see shared views. For more information on assigning capabilities to a role in Splunk Enterprise Security, see Add capabilities to a role.
Administrators can turn on the capability to enable analysts to use shared views, table filters, and table columns on the Incident Review page. This capability is turned off by default and might take a few minutes to turn on.
A user, analyst, or administrator can create a public or a private view using filters. An administrator can enable any public view to be available to other users and analysts. However, if the author of the view converts the view setting from public to private or deletes the view, the administrator and other users will lose access to the view,
Use the following table to identify access to shared views by the author of the view such as a user, an analyst, or an administrator:
| Access control | Public views | Private views |
|---|---|---|
| Read | Y | Y |
| Write | Y | Y |
| Delete | Y | Y |
| Set as default | Y | Y |
| Share view with everyone | Y | Y |
| Create or update the default global view | N | N |
Use the following table to identify administrator role access to public and private views:
| Access control | Public views | Private views | |
|---|---|---|---|
| Read | Y | N | |
| Write | Y | N | |
| Delete | Y | N | |
| Set as default | Y | N | |
| Share view with everyone | Y | N | |
| Create or update the default global view | Y | N |
Use the following table to identify user access to public and private views:
| Access control | Public views | Private views |
|---|---|---|
| Read | Y | N |
| Write | N | N |
| Delete | N | N |
| Set as default | Y | N |
| Share view with everyone | N | N |
| Create or update the default global view | N | N |
Create saved views in Incident Review
Reuse the groups of filtered notables during an investigation by saving views. You can reuse saved views or make edits to existing views based on specific fields. Additionally, you can also save a view as a default.
- From the Splunk Enterprise Security menu bar, select the Incident Review page.
- Add the fields that you want to use to group the notables such as Unassigned, Critical, and so on in the Search notables filter.
You can select Clear all to remove all the filters that you used to group the notables. You can also remove specific filters by clicking the X next to the field used to filter the notables. - Customize the table column settings and apply the changes so that the table column settings for the notables can be displayed in the view. See Customize table column settings.
The table column settings are stored in the saved view based on the selected fields and the order in which they are displayed on the Incident Review page. - Select Save on the Incident Review page.
- In the Save View dialog, go to View Configuration and verify the fields that you want to use to group the notables.
For example, Urgency: Low, Medium, High, Critical; - In View Name, enter a name for the view.
- Check Save as my Default if you want to add it as the default view.
- Select Share with all Enterprise Security Users to share the view with other users.
You can also see all existing views by selecting Existing in the Save View dialog box. - Verify that the view is in the Saved Views drop down menu on the Incident Review page.
Delete a shared view if the view is no longer useful and you do not plan to use the view or share it with other analysts.
Follow these steps to delete a shared view:
- In the Splunk Enterprise Security app, go to the Incident Review page.
- On the Incident Review page, select Manage Saved Views in the Saved Views drop-down.
- Identify the view that you want to delete.
- Select the Delete button.
You might receive a warning message indicating that selecting the '''Delete''' button can move users to the global default view that was selected by the administrator.
Follow these steps to unshare a saved view that was previously available to all users.
- In the Splunk Enterprise Security app, go to the Incident Review page.
- On the Incident Review page, select Manage Saved Views in the Saved Views drop-down.
- Select the view that you want to edit.
This opens the Edit View dialog for the selected view. - De-select Share with all Enterprise Security users.
You might see a warning that removing the sharing option moves users to the global default view selected by the administrator.
Customize table settings to display notable fields
Follow these steps to display specific fields for a notable in the table on the Incident Review page:
- In the Splunk Enterprise Security app, go to the Incident Review page.
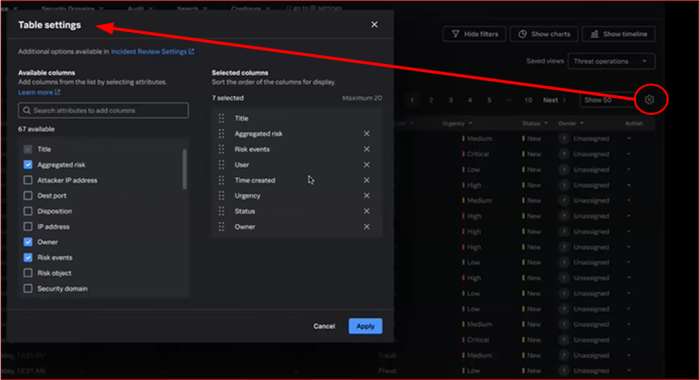
- Select the gear icon to open the Table Settings dialog.
- Select the fields that you want to display in the table on the Incident Review page from the Available Columns. The fields you select get displayed in the Selected Columns.
- (optional)Reorder the selected fields in the Selected Columns based on the order in which you want them to display.
- Select Apply to apply your changes to the table.
The following screenshot shows how you can use the Table Settings to specify the fields that you want to display for a notable on the Incident Review page:
Configure auto-refresh to update notables
Configure a specific frequency to refresh notables on the Incident Review page so that notables get automatically updated and new notables can be addressed in a timely manner.
Follow these steps to configure a specific frequency to auto-refresh notables:
- In the Splunk Enterprise Security app, select Configure.
- Select Incident Management, then select incident Review Settings.
- Go to Incident Review - auto refresh.
- Turn on Allow auto refresh.
- Select the default state whether you want auto-refresh to be tuned off by default or not.
- Select a default time to auto-refresh notables from the Time interval drop down. You can select any of the following options: 30 seconds, 1 minute, 2 minutes, or 5 minutes.
After auto-refresh is configured in the Incident Review Settings, you have the option to turn it on or off when you select Auto refresh on or Auto refresh off from the Incident Review page.
Modify analyst capabilities and permissions
Configure whether analysts can override the calculated urgency of a notable event and choose whether to require an analyst to add a comment when updating a notable event on the Incident Review Settings page.
- Select Configure > Incident Management > Incident Review Settings to view the Incident Review settings.
- Allow or prevent analysts from overriding the calculated urgency of a notable event with the Allow Overriding of Urgency checkbox. Analysts are allowed to override urgency by default.
- Require analysts to add a comment when updating a notable event by checking the Required checkbox under Comments.
- If you require analysts to add a comment, enter the minimum character length for required comments. The default character length is 20 characters.
Configure the recommended capacity for analysts
Configure the recommended maximum number of notable events that should be assigned per security analyst on the General Settings page.
- Select Configure > General > General Settings to view the General Settings.
- Enter a preferred number of notable events that should be assigned to an analyst with the Incident Review Analyst Capacity setting. The default is 12.
This value is used for audit purposes, and does not prevent more than the default number of notable events from being assigned to an analyst.
Change Incident Review columns
You can change the columns displayed on the Incident Review dashboard.
- Review the existing columns in Incident Management > Incident Review Settings > Table and Event Attributes.
- Click + Add Column to add new table attributes or click X to delete existing columns. You can also drag and drop to change the order of the available columns.
in Splunk Enterprise Security version 7.2 and higher, the consolidated panel for '''Table and Event Attributes''' displays only when you turn on the feature flag. Prior to turning on this feature, ensure that all table attributes are copied into the panel for event attributes. Additionally, configuring local overrides might prevent the display of the '''Table and Event Attributes''' panel in the Incident Review settings page as expected. If you want to retain the local overrides, you can add and reorder columns to retain table attributes based on your specific environment.
Troubleshoot an issue where analysts cannot edit notable events successfully on Incident Review
If analysts cannot edit notable events successfully on Incident Review, several issues could be the cause.
- The analyst might not have permission to make status transitions. See Manage notable event statuses.
- The analyst might be attempting to edit a notable event that is visible, but cannot be edited successfully due to the limited number of events that can be retrieved from a bucket.
If a correlation search creates a high number of notable events in a short period of time, such as 1000 in less than five minutes, the Incident Review dashboard can hit the max_events_per_bucket limit when attempting to retrieve notable events for display from the notable index.
If analysts are unable to edit a notable event for this reason, the analyst can use a smaller time range when reviewing notable events on Incident Review. For example, a time range that reduces the number of events on the Incident Review dashboard to less than 1000. 1000 is the default value of max_events_per_bucket, so search that produces less than 1000 events cannot produce this error.
To prevent this from happening at any time, you can modify the maximum number of events that can be returned from a bucket. However, modifying this setting can negatively affect the performance of your Splunk software deployment.
If you are running Splunk Enterprise Security on Splunk Cloud Platform, file a support ticket for assistance with this setting.
- Open
limits.conffor editing. See How to edit a configuration file in the Splunk Enterprise Admin Manual. - Set
max_events_per_bucketto a number above 1000. - Save.
See limits.conf for more about the max_events_per_bucket setting.
Create a short ID column to filter notables
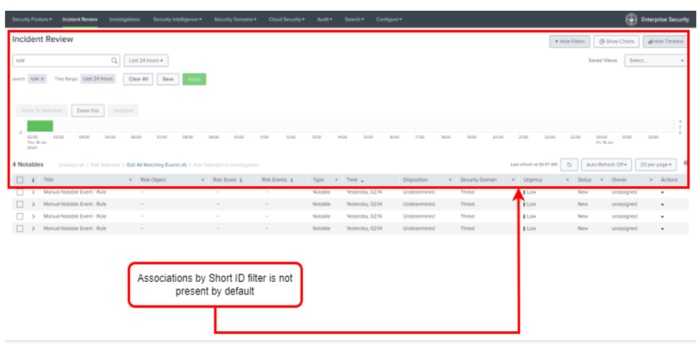
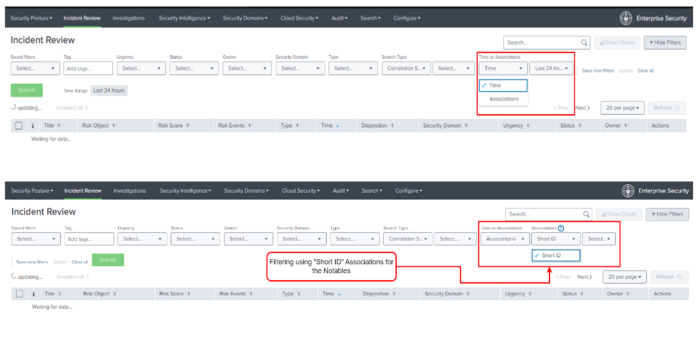
The short ID filter is not available by default once you upgrade to Splunk Enterprise Security version 7.3.0.
The following screenshot indicates that Short ID is not displayed on the Incident Review page in Splunk Enterprise version 7.3.0 and higher.

The following screenshot indicates that Short ID is available on the Incident Review page in Splunk Enterprise version 7.2.0 and lower.

If you want to use the short ID filter for notables on the Incident Review page in Splunk Enterprise Security version 7.3.0 and higher, you can create the short ID column filter using table attributes. For more information on short IDs for notables, see Create a short ID for a notable in the Splunk enterprise Security Admin manual.
Follow these steps to create a short ID column using table attributes to filter notables:
- In the Splunk Enterprise Security app, select Configure.
- Select Incident Management and then select Incident Review Settings.
- Go to Incident Review - Table and Event Attributes section.
- Locate the appropriate attribute name for the Short ID.
- Select +Add Field
- In the Edit Event Attribute dialog, enter the following values to establish the connection between short IDs and notables within the Incident Review framework:
- Field:
notable_xref - Label:
Short ID
- Field:
- Select Save on the Incident Review Settings page.
- Use the gear icon in the Incident Review page to select the columns that you want to display.
The '''Short ID''' column is added to the table within the enhanced Incident Review workflows.
| Managing Incident Review in Splunk Enterprise Security | Manually create a notable event in Splunk Enterprise Security |
This documentation applies to the following versions of Splunk® Enterprise Security: 7.3.0, 7.3.1, 7.3.2, 7.3.3

 Download manual
Feedback submitted, thanks!