Sort and filter findings and investigations for triage in Splunk Enterprise Security
Sort and filter findings and investigations in the analyst queue on the Mission Control page to identify specific findings and investigations and accelerate the triage process. Sorting and filtering findings and investigations can help you categorize, track, and assign findings to analysts based on specific criteria, so that you can identify potential threats faster.
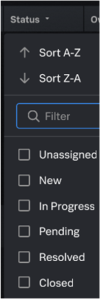
For example, the ability to filter findings and investigations using the Status field removes the need to review unrelated statuses and prevents statuses from being duplicated. You can select the In-progress status from the available statuses, such as Unassigned, New, In-progress, Resolved, or Closed, to display only the findings or investigations that are currently in progress.
Alternatively, you can enter a specific filter criterion and add it to the list of filter options. For example, you can add the ID, labels, and corresponding fields in the analyst queue to filter findings and investigations.
If you want to run a Search Processing Language (SPL) search in the analyst queue to filter for findings and investigations, you must wrap the search with double quotation marks. For example, "SPL SEARCH" . When using OR after your search, also add double quotation marks around the values. For example, OR (name="value" OR description="value" OR rule_name="value").
The following screenshot shows some of the sort and filter options for findings and investigations in the analyst queue.
Filter by a default view in the analyst queue
The analyst queue includes default views that can help you quickly filter and sort findings, finding groups, and investigations. All default views use a time frame of 24 hours unless an admin sets a different default time frame. Splunk Enterprise Security includes the following default views:
| Default view | Description |
|---|---|
| All | No filters. Use this default view to reset all filters. |
| Owned by me | Items in the analyst queue assigned to you. |
| Unassigned | Items in the analyst queue without an assigned owner. |
| Risk score | All items in the analyst queue sorted by risk score from high to low. |
To filter the analyst queue by a default view, follow these steps:
- In Splunk Enterprise Security, select the Mission Control page.
- Select the arrow icon (
 ) to open the left-side panel on the analyst queue.
 - Select a default view, such as Owned by me or Risk score.
Change the time frame for a default view
The analyst queue has a default time frame set to 24 hours, which means that all items in the analyst queue have been created or edited in the last 24 hours. As a Splunk Enterprise Security admin, you can change the default time frame to a value like 48 hours, 72 hours, or 7 days. To make any other filtering changes, you must create a new saved view. See Create saved views.
To change the default time frame for the analyst queue, see Add a default time range for findings and investigations.
Sort the findings and investigations
Follow these steps to sort the findings and investigations in Splunk Enterprise Security:
- In Splunk Enterprise Security, select the Mission Control page.
- In the analyst queue, select the down arrow next to the column heading.
- Select A to Z or Z to A to sort the column in ascending or descending order on the analyst queue.
Filter the findings and investigations
Follow these steps to filter the findings and investigations in Splunk Enterprise Security:
- In Splunk Enterprise Security, select the Mission Control page.
- In the analyst queue, select the down arrow next to a specific column heading, such as Status.
- Select a value to filter by. For example, for Status, you can select In-progress or New to filter the findings or investigations that are either in progress or newly created in the analyst queue.
See also
For more information on the analyst workflow in Splunk Enterprise Security, see the product documentation:
- Manage analyst workflows using the analyst queue in Splunk Enterprise Security
- Overview of Mission Control in Splunk Enterprise Security in the Use Splunk Enterprise Security manual.
- Triage findings and investigations in Splunk Enterprise Security in the Use Splunk Enterprise Security manual.
| Configure the settings for the analyst queue in Splunk Enterprise Security | Manage saved views to display findings and investigations in Splunk Enterprise Security |
This documentation applies to the following versions of Splunk® Enterprise Security: 8.1.0

 Download manual
Feedback submitted, thanks!