Dashboards in Splunk App for Fraud Analytics
The Splunk App for Fraud Analytics includes the following preconfigured dashboards:
- Business View: Executive dashboards that provide a high level overview based on time range and risk score threshold.
- Investigate: Analyst dashboards with filtered data that you can access using the Actions drop down on the Incident Review page in Splunk Enterprise Security or Splunk App for Fraud Analytics.
Business View dashboards
Includes the following dashboards that provide high level executive information on fraud and risk exposure:
Business Risks and Remediation Summary dashboard
Provides a summary of current risk exposure as well as an overview of active threat factors in your security environment. This dashboard contains the following two primary panels:
- Business Risk and Remediation Summary panel: Focuses on the risk exposure of your SOC
- Current Threats: Focuses on the threats to your SOC
Use the following table for information on the Business risk and remediation summary panel to monitor your SOC:
You must customize these panels by specifying the data and the calculation logic that populates these dashboards.
| Panel | Description |
|---|---|
| Current business risk | Displays additional risk factors corresponding to customer accounts under attack. High value or potentially high risk customer accounts are tagged with specific risk tags such as Compliance, Cybersecurity, Investment, and so on to indicate suspicious or risky activity. Risk tags, if available, are configured based on customer data. |
| Accounts affected | Displays the number of accounts that were monitored during the specified time period. |
| Immediate risk exposure | Summarizes the dollar amount of suspicious money movements. The dollar amounts are based on the value of money transactions and are customized for the user's environment. |
| Accounts protected | Total number of accounts that were under attack but were remediated. |
| Total value protected | Summarizes the dollar amount of potentially vulnerable assets associated with the accounts that were under attack but were remediated. |
Use the following table for information on the Current threats panel to monitor your SOC:
These panels display different views of the various risk-based correlation searches or risk incident rules that trigger risk notables. Data populating these dashboard panels derive from the data models in the Splunk App for Fraud Analytics and the risk index.
| Panel | Description |
|---|---|
| Current threat types | Pie chart displaying the distribution of risk events based on specific risk incident rules. |
| Threat contributors | Pie chart displaying the distribution of risk events based on specific threats types. |
| Threats and contributors link | List displaying the frequency of occurrence for specific threat types. |
Fraud Posture dashboard
Provides statistics based on the number and location of events, including additional data on website and application performance. You can filter the data based on time range and risk score threshold.
Use the following table for information on the numeric panels included in the Fraud Posture dashboard to monitor your security environment:
| Panel | Description |
|---|---|
| Suspected fraud | Notable alerts generated during a specific time range for suspected fraud. |
| Confirmed fraud | Investigations that concluded as fraud investigations. |
| False positives | Investigations that were not identified as fraud. |
| Working cases | Investigations that are in progress. |
External data populates all the panels in this table, excluding the Suspected Fraud panel. The Suspected fraud panel relies on the case management tool that is used in your SOC.
Use the following table for information on the remaining panels included in the Fraud Posture dashboard to monitor your security environment:
| Panel | Description |
|---|---|
| Risk events by user | Distribution of risk events by user based on the aggregated risk score. |
| Risk rule frequency | Distribution of different risk rules based on frequency of occurrence. |
| Applicants by IP address geo-location (World) | Origin of the new account activity around the world. |
| Applicants by IP address geo-location (USA) | Origin of the new account activity in the United States. |
| New accounts: Sign up volume | Distribution of the number of new account signups based on time. Unexpected visual trends (peaks, dips, high deny volume) might be identified as fraud or an IT operations or a security issue, which might be used for anomaly detection. |
| Web traffic: View by status code | Color indicators to identify status codes for web traffic. |
Investigate dashboards
Access the Investigate dashboards using the Action drop down menu in the Incident Review page of Splunk Enterprise Security. You can also access the Investigative dashboards from the application menu of the Splunk App for Fraud Analytics.
Change columns in the Fraud Incident Review table
Follow these steps to change the columns displayed on the Fraud Incident Review dashboard:
- Review the existing columns in Incident Review - Table Attributes.
- Use the Action column to edit, remove, or change the order of the available columns.
- Add custom columns by selecting Insert below or selecting More..., then Insert above.
For example: You can change the field name for risk_score_total to Risk Score Total.
Web Traffic Analysis dashboard
Displays user behavior based on web and application logs data.
Use the following table for information on the panels in the Web Traffic Analysis dashboard:
| Panel | Description |
|---|---|
| Combined time chart of all events | Statistical aggregation of all events with time on the X-axis. |
| Selected events | Comparison of the statistical aggregation of all events versus filtered events based on a specific field, with time on the X-axis. |
| Multi-field interactive investigation panel | Interactive panel that displays events categorized by fields such as Country, IP address, Region, and so on. Clicking on the field values in this panel filters data based on specific fields and displays the connections between the various events based on fields. |
| Detailed web traffic activity | Filtered view of events based on user activity in the other interactive panels. |
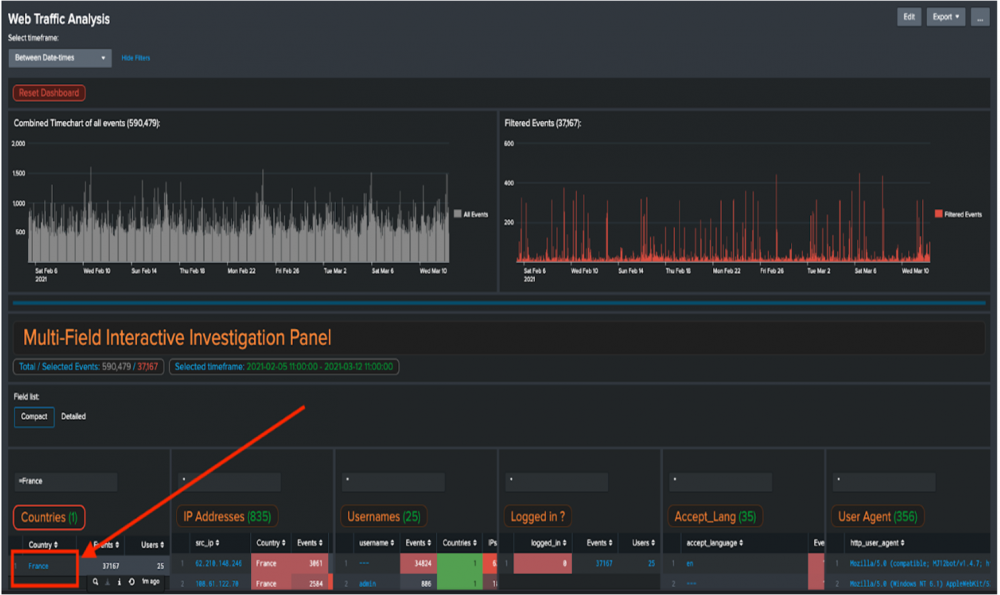
The following figure indicates how to use the Web Traffic Analysis dashboard in the app for fraud investigations.

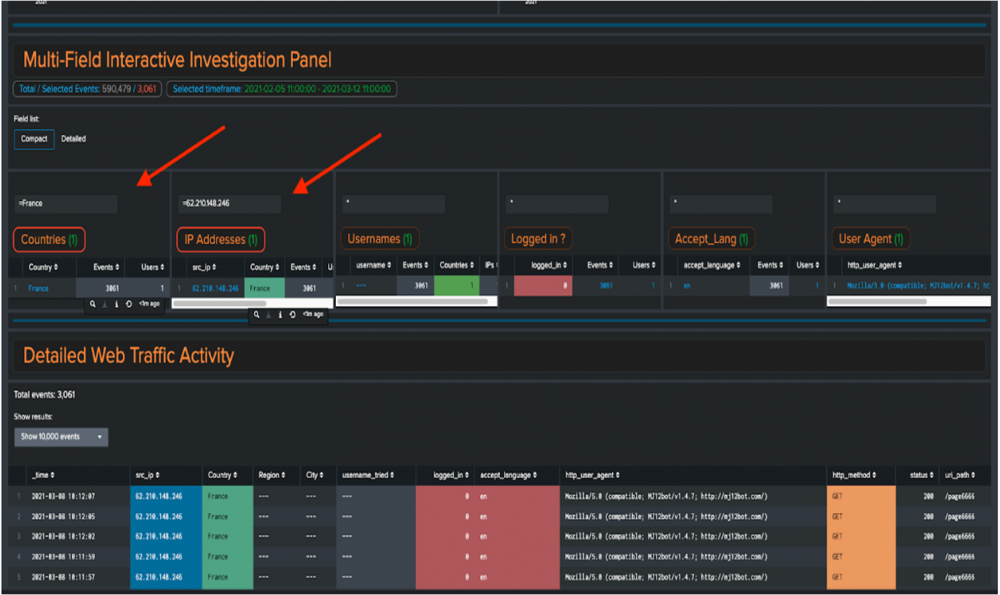
In this example, clicking on the field value of the Country France highlights the Country header. Similarly, clicking on the another field value such as IP address highlights the IP address header.
The following figure indicates how to filter events in the Web Traffic Analysis dashboard for fraud investigations.

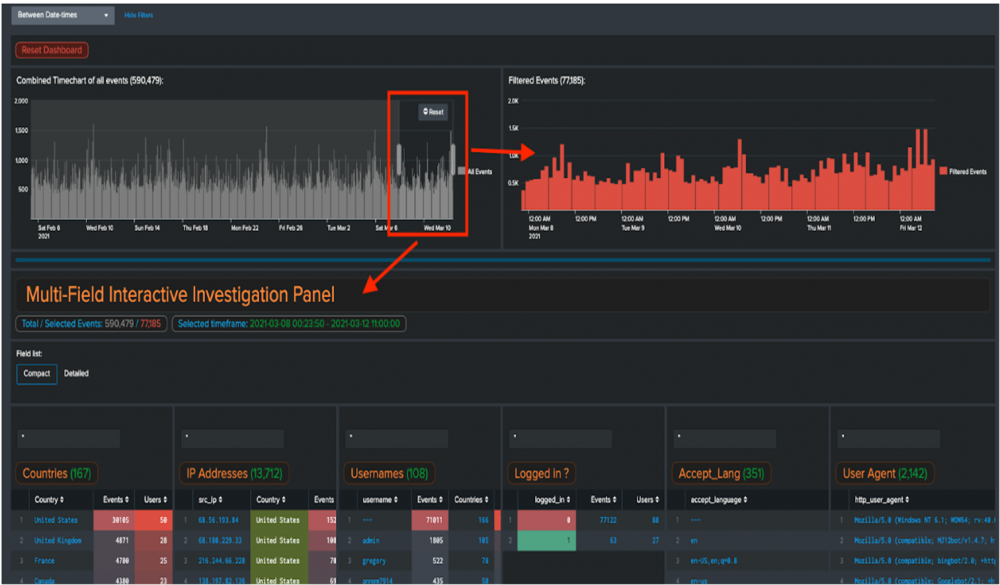
You can also pre-filter events by clicking and dragging the left time chart to create a smaller time window and create a filtered view of events in the right time chart and in the panels.
The following figure indicates how to pre-filter events using time charts in the Web Traffic Analysis dashboard for fraud investigations.

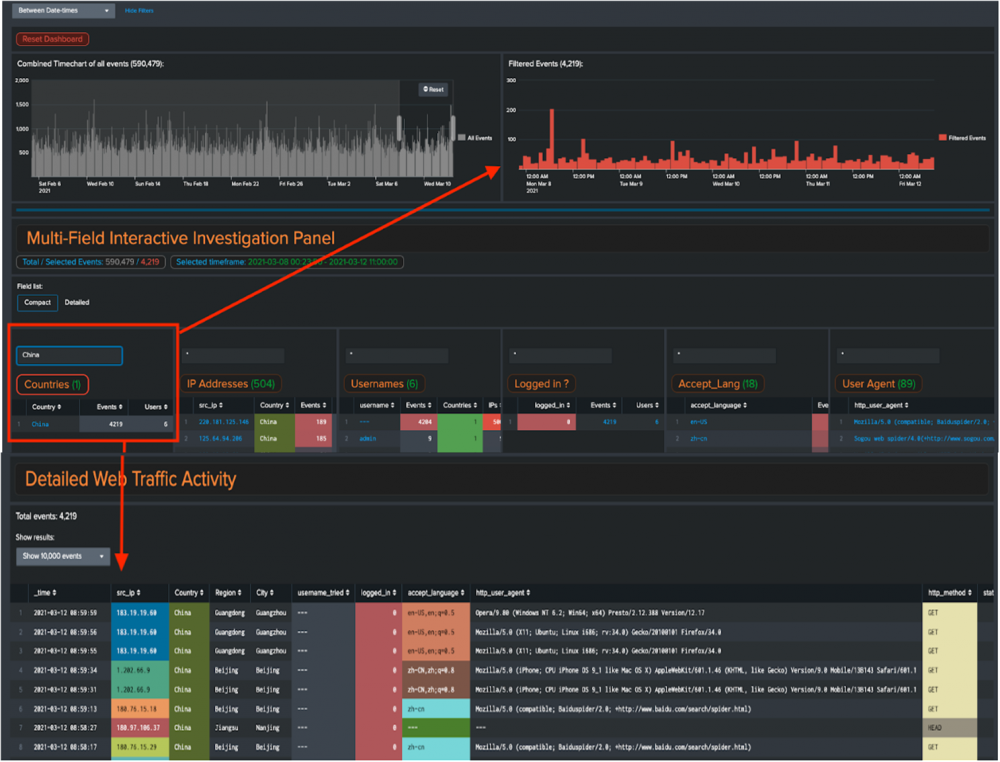
Entering some text into one of the filter fields further filters the time chart of filtered events and the detailed web traffic. In this example, when you type the country "China", both the bar chart and the web traffic display 4219 filtered events.
The following figure indicates how to further filter events in the Web Traffic Analysis dashboard for fraud investigations.

Fraud Risk Exposure Analysis dashboard
Interactive dashboard that lets you filter events based on your display preferences.
The top and bottom panels in this dashboard are filtered based on selections in the Interactive Investigation panel. The time charts panels do not filter any data.
Use the following table for information on the panels in the Fraud Risk Exposure Analysis dashboard:
| Panel | Description |
|---|---|
| Money movement events | Financial transactions between accounts over time |
| Interactive investigation: User accounts and risk analysis | Provides interactive information on attempts to access accounts, changes to accounts, relationships between data fields, as well as suspicious users, sessions, and IP addresses |
| Detailed portal activity | Activity details based on filters |
Customer Accounts Analysis dashboard
Single panel dashboard that helps to investigate relationships between customer accounts, notables, and various fields.
Fraud Incident Review dashboard
The Incident Review dashboard in the Splunk App for Fraud Analytics is similar to the Incident Review page in Splunk Enterprise Security. This dashboard surfaces all notable events, specifically related to potential fraud, and categorizes them by severity so that analysts can quickly triage, assign, and track issues. You can customize how analysts view and interact with notable events on the Fraud Incident Review dashboard by changing the columns in the table.
| Configure Splunk App for Fraud Analytics | Data models in Splunk App for Fraud Analytics |
This documentation applies to the following versions of Splunk® App for Fraud Analytics: 1.1.3, 1.2.4
 Download manual
Feedback submitted, thanks!