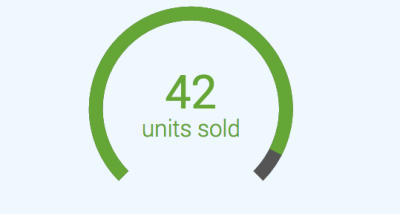
Using horseshoe meters
| This feature is deprecated. |
|---|
| The horseshoe meter visualization is deprecated as of version 1.5.0. It will be archived and removed from Splunkbase on December 21, 2024. After removal, visualizations previously installed in environments will remain available but unsupported.
As an alternative, you can create single value radial visualizations with Dashboard Studio. For more details, see Single value radial in the Dashboard Studio manual. |
Learn how to visualize data with a horseshoe meter.
What horseshoe meters visualize
Use a horseshoe meter to gauge metric changes against a set of ranges or a target value.
Use case examples
A horseshoe meter can visualize metrics for many kinds of data.
- Track sales or other key performance indicators.
- Monitor failed logins and other discrete network events.
Data for horseshoe meters
Use any data with a metric that you can aggregate to generate a single value.
| Horseshoe meter installation |
This documentation applies to the following versions of Horseshoe Meter (EOL): 1.0.0, 1.1.0, 1.2.0, 1.3.0, 1.4.0, 1.5.0, 1.5.1

 Download manual
Feedback submitted, thanks!