About the Splunk Infrastructure Monitoring entity integration in ITE Work
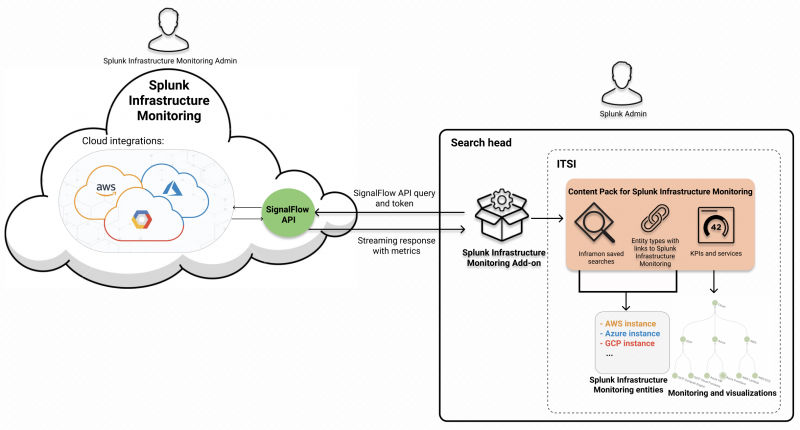
The (ITE Work) entity integration with Splunk Infrastructure Monitoring lets you use ITE Work monitoring tools to investigate and troubleshoot your AWS, Azure, and GCP instances from Splunk Infrastructure Monitoring. The integration leverages the Splunk Infrastructure Monitoring Add-on, which runs on the search head cluster and provides generating search commands that fetch metrics and event data from your Splunk Infrastructure Monitoring account. For setup instructions, see Integrate Splunk Infrastructure Monitoring with ITE Work.
Fetch data with the Splunk Infrastructure Monitoring Add-on
The Splunk Infrastructure Monitoring Add-on brings metrics and event data from Splunk Infrastructure Monitoring into ITE Work on-demand. The return data bypasses Splunk indexes and directly streams into the Splunk interface. You can further manipulate the Splunk Infrastructure Monitoring data using Splunk Search Processing Language (SPL) to fit your specific use case. ITE Work takes the data and populates the ITE Work summary index with the appropriate metrics and events. For more information, see Set up Infrastructure Monitoring.
Add structure to your data with the Content Pack for Splunk Infrastructure Monitoring
When you install the Content Pack for Splunk Infrastructure Monitoring, ITE Work entity discovery searches use the Splunk Infrastructure Monitoring Add-on to identify AWS, Azure, and GCP integration instances in your organization. The searches bring your cloud instances into ITE Work in the form of entities and associate them with entity types. Each Splunk Infrastructure Monitoring entity contains a navigation link in the entity health dashboard leading back to the corresponding instance within Splunk Infrastructure Monitoring. The content pack automatically creates ITE Work services corresponding to each integration type, which include KPIs to monitor critical functions.
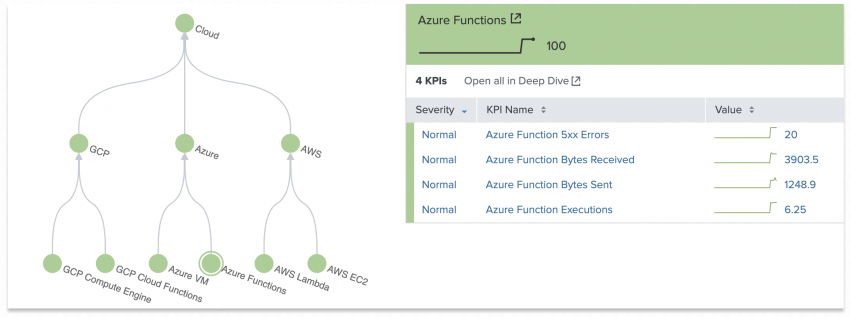
Once you configure the Splunk Infrastructure Monitoring integration, use the service topology tree included in the content pack to monitor multiple cloud integrations all in one place. The following image shows the populated service topology tree:
| About the VMware vSphere entity integration in ITE Work |
This documentation applies to the following versions of Splunk® IT Essentials Work: 4.18.0, 4.18.1, 4.19.0, 4.19.1, 4.19.2, 4.19.3, 4.19.4, 4.20.0, 4.20.1


 Download manual
Feedback submitted, thanks!