Use the Content Pack for Splunk Synthetic Monitoring
After you install and configure the content pack, you can immediately start monitoring your web applications' performance. The content pack contains several useful views and dashboards that provide visibility into the different metrics of your applications.
Monitor services for your web applications
The service analyzer included in this content pack provides instant, real-time visibility into the performance of your web applications with granular, composite performance metrics across the entire service tree. Detect service anomalies faster with visibility into the performance of each one of the service components that affect your applications' overall performance.
To access the custom Splunk Synthetic Monitoring service analyzer, select Service Analyzer > Default Analyzer from the ITSI menu.

Select Tree view to view your service tree.

Customize and save the Service Analyzer
To make customizations to the service analyzer, use the Filter services field to only show synthetic checks that are relevant to you. When the service analyzer is filtered to the checks you want to monitor select Save as... to create a new service analyzer.
Monitor your applications' entities
The content pack includes 5 custom entity types that group entities originating from the Splunk Synthetic Monitoring Add-on.
- Synthetic API
- Synthetic Benchmark
- Synthetic Content
- Synthetic HTTP
- Synthetic Real Browser
View Entity Health
To view the Entity Health page for the entity type, follow these steps:
- From the ITSI menu or IT Essentials Work menu, select Infrastructure Overview.
- In the Group by dropdown, choose Entity Type.
- Select the one of the synthetic entity types.
View Entity Details
On the Entity Health page to drill down further into specific entity follow these steps:
- Select an entity.
- Use the Select a Check... dropdown to go to the entity details page for the check you would like to review.

Each entity is set up with navigation links to allow you to quickly navigate to Splunk Synthetic Monitoring. To do so, follow these steps:
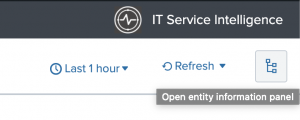
- From the entity details page, select the Open entity information panel.
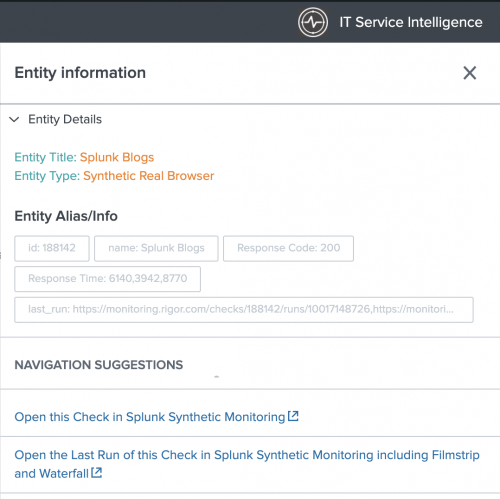
- Select one of the navigation suggestions:
- Open this Check in Splunk Synthetic Monitoring.
- Open the Last Run of this Check in Splunk Synthetic Monitoring including Filmstrip and Waterfall.


For more information about entity types, see Overview of entity types in ITSI in the Entity Integrations manual.
Set up alerts for your applications
Because acceptable metrics vary by application, the synthetics services don't have alert thresholds set up by default. Go to the KPI Alerting documentation for steps to set up alert thresholds to generate notable events for your services and KPIs.
Once you set up alerts for your KPIs they are aggregated into meaningful episodes on the Episode Review page. To monitor and investigate all episodes for your applications, go to Episode Review. You can drill down into individual episodes to perform more granular root-cause analysis.
For more information about navigating and using Episode Review, go to the Overview of Episode Review in ITSI in the Event Analytics manual.
| Create a custom configuration of the Content Pack for Splunk Synthetic Monitoring | KPI reference for the Content Pack for Splunk Synthetic Monitoring |
This documentation applies to the following versions of Content Pack for Splunk Synthetic Monitoring: 1.0.2
Feedback submitted, thanks!