 Download topic as PDF
Install and configure the Content Pack for VMware Monitoring
Perform the following high-level steps to configure the Content Pack for VMware Monitoring:
- Install and configure the Splunk Add-on for VMware Metrics
- Install the Content Pack for VMware Monitoring
- Review and tune the VMware KPI base searches
- Review and tune the KPI thresholds
- Turn the simple service tree into a complex tree
Prerequisite
Create a full backup of your ITSI environment in case you need to uninstall the content pack later. For more information, see Create a full backup in the Administer Splunk IT Service Intelligence manual.
Install and configure the Splunk Add-on for VMware Metrics
To bring the metrics data for these data sources into ITSI, you must download the Splunk Add-on for VMware Metrics from Splunkbase and install it before installing the content pack. For instructions, see Installation and configuration overview for the Splunk Add-on for VMware Metrics in the Splunk Add-on for VMware Metrics manual.
(Optional) Update the index search macro with custom index
To use custom indexes, update the index search macros shipped with the content packs.
Prerequisites
- You should have the
adminrole to update the index search macro. - You should know which indexes your organization uses to send data from the Add-on to your Splunk platform deployment.
Steps
1. From Splunk Web, select Settings > Advanced Search > Search Macros.
2. Configure the custom index as per requirements as outlined in the following table:
| Macro Name | Index Type | Default Macro Definition | Macro Definition with Custom Index |
|---|---|---|---|
| cp_vmware_perf_metrics_index | Metrics | index=vmware-perf-metrics
|
All of the indexes that you're using for data collection from add-ons combined with OR operators.
|
3. Select Save.
Install the content pack
The Content Pack for VMware Monitoring is automatically available for installation once you have installed the Splunk App for Content Packs on the search head with ITSI 4.8.0 or higher. For steps to install the Splunk App for Content Packs, go to the installation instructions for the Splunk App for Content Packs. After you install the Splunk App for Content Packs, you can follow these steps install the content pack:
- From the ITSI main menu, click Configuration > Data Integrations.
- Select Add content packs or Add structure to your data depending on your version of ITSI.
- Select the VMware Monitoring content pack.
- Review what's included in the content pack and then click Proceed.
- Configure the settings:
- Choose which objects to install: For a first-time installation, select the items you want to install and deselect any you're not interested in. For an upgrade, the installer identifies which objects from the content pack are new and which ones already exist in your environment from a previous installation. You can selectively choose which objects to install from the new version or install all objects.
- Choose a conflict resolution rule for the objects you install: For upgrades or subsequent installs, decide what happens to duplicate objects introduced from the content pack. Choose from these options:
- Install as new: Any existing identical objects in your environment remain intact.
- Replace existing: Existing identical objects are replaced with those from the new installation. Any changes you previously made to these objects are overwritten.
- Import as enabled: Select whether to install objects as enabled or leave them in their original state. We recommend that you import objects as disabled to ensure your environment doesn't break from the addition of new content. This setting only applies to services, correlation searches, and aggregation policies. All other objects such as KPI base searches and saved searches are installed in their original state regardless of the option you choose.
- Add a prefix to your new objects: Optionally, append a custom prefix to each object installed from the content pack. For example, you might prefix your objects with
CP-to indicate they came from a content pack. This option can help you locate and manage the objects after installation. - Backfill service KPIs: Optionally backfill your ITSI environment with the previous seven days of KPI data. Consider enabling backfill if you want to configure adaptive thresholding and predictive analytics for the new services. This setting only applies to KPIs, not service health scores.
- When you've made your selections, click Install selected.
- Click Install to confirm the installation. When the installation completes you can view all objects that were installed in your environment. A green checkmark on the Data Integrations page indicates which content packs you've already installed.
Review and tune the KPI base searches
Within ITSI, go to Configuration > KPI Base Searches and review the following KPI base searches shipped with this content pack:
VMWARE: VMware Datastores CapacityVMWARE: VMware Datastores I/OVMWARE: VMware ESXiVMWARE: VMware vCenterVMWARE: VMware Virtual Machines
If you're not using the default indexes used by Splunk_TA_VMware, you need to edit the search strings for each base search to match your index structure.
The KPI base searches are specifically optimized for use with data from the Splunk Add-on for VMware Metrics. They all run every minute with a five-minute lookback, using only the latest value on a per-entity basis. The 5-minute lookback ensures that you won't see N/A for less frequent data. The combination of "every-minute" and "latest" means that for data collected more frequently, the KPI status is updated as quickly as possible. Tune each base search to run at a frequency matching your data collection interval.
Review and tune the KPI thresholds
The KPIs in each service template are tied to the VMware KPI base searches and have thresholds representing best practices. KPI thresholds are set to use Normal / Low / Medium at the aggregate level. Per-entity thresholds do not exceed Medium except for available disk space. The use of lower threshold levels for monitoring allows application-level KPIs to take a more prominent threshold level. For example, a server at 100% CPU isn't a critical issue if the apps running on that server are responding as they should.
You must tune these threshold values according to your environment. Use the corresponding linked services to validate your thresholds. For more information, see Configure KPI thresholds in ITSI in the Service Insights manual.
Turn the simple service tree into a complex tree
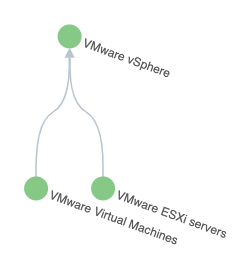
Once you install the content pack and configure the thresholds in your VMware services, the service topology tree looks something like this:
You can further break down hypervisors monitoring by datacenter and cluster. You can't break down virtual machines unless you modify the base search. When designing your topology tree, your goal is to create a service mapping to a pool of resources, with the intent that ITSI monitors the individual entities within this resource pool using entity thresholds. It's best to not create hundreds of services. Larger groupings of similar types of entities is sufficient.
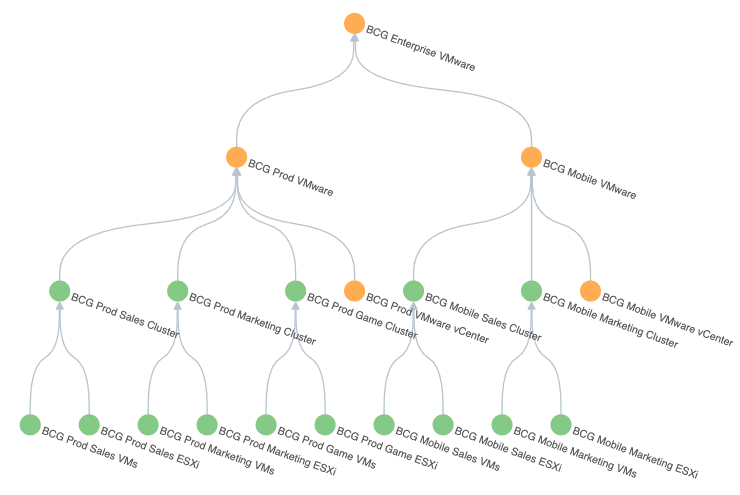
Import additional services through CSV files and link them to the corresponding service templates included in this content pack. For more information about importing entities and services from a CSV file, see the following topics:
For example, the following CSV import yields a more comprehensive service topology view:
|
PREVIOUS Release Notes for the Content Pack for VMware Monitoring |
This documentation applies to the following versions of Content Pack for VMware Monitoring: 1.1.0, 1.1.1, 1.2.0


Feedback submitted, thanks!