Using the Entity Overview in Splunk App for Infrastructure
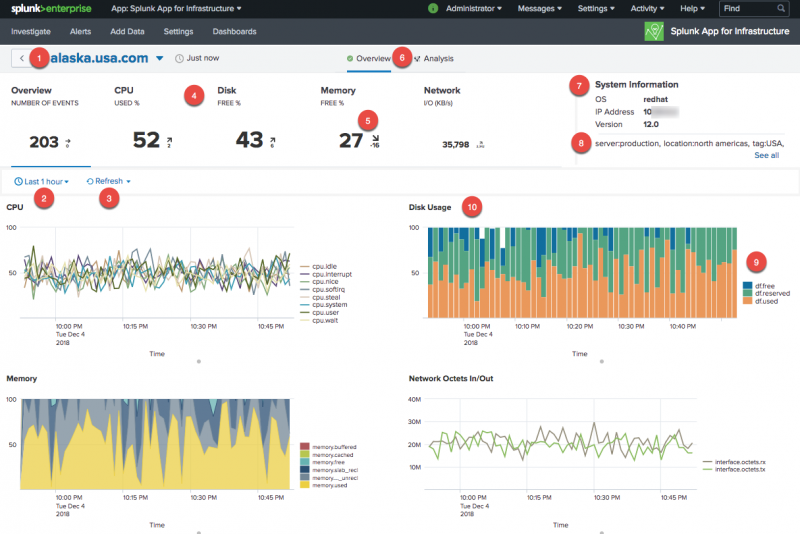
The Entity Overview contains performance charts that give a quick view of the performance of Infrastructure entities. From this overview, get a summary of metrics being used by the entity, including CPU, network, memory, disk, system information, dimensions and more. Click a metrics area to display detailed charts for the selected metric area, and hover over an area or select a metric from list in the chart to display isolated metric information.
The Entity Overview is available for the single entities only, and is not available for groups at this time.
| Number | Element | Description |
|---|---|---|
| 1 | Entity | The name of the entity for which the details are displayed in the overview. |
| 2 | Refresh | Select how often to refresh the overview. You can set to Auto Refresh, refresh in seconds or minutes, or set refresh to off and manually refresh. |
| 3 | Time picker | Select the time period for which you want to display in the overview. |
| 4 | Metric tabs | Metrics tabs identify the areas of metrics displayed in the overview charts.
|
| 5 | Metric area | Tabs identify an individual metric area. A numeric value displays beneath the name of the metric area, and represents values such as disk free percent. The arrow next to the value displays values increasing or decreasing, and the number value represents the activity in the given time period. |
| 6 | Overview tab or Analysis tab | Click the Overview tab to display the Entity Overview and view metric details of an entity. Click the Analysis tab to drill down to the Analysis Workspace. |
| 7 | System Information | Displays system information for the entity displayed in the overview. |
| 8 | Dimensions | Displays dimensions of the entity displayed in the overview. |
| 9 | List of metrics in a chart | Every chart displays a color-coded list of metrics. Each metric displays as a visual data value in the chart, such as a line chart of stack chart. Hover over a specific metric to isolate and display that selected metric in the chart. |
| 10 | Overview chart | A chart contains a visualization representing data. Each chart is identified by the name of the metric area or metric. The chart displays a list of metrics as a visualization, and each metric value is represented by a color-coded visual identifier. Hover or click an area to isolate details of a selected metric, or click a metric in the chart list to isolate data in the visualization and display details only for that metric. The charts are view only and cannot be edited. |
| Using the Analysis Workspace in Splunk App for Infrastructure | About Analytics in the Analysis Workspace in Splunk App for Infrastructure |
This documentation applies to the following versions of Splunk® App for Infrastructure (EOL): 1.3.0, 1.3.1, 1.4.0, 1.4.1, 2.0.0, 2.0.1, 2.0.2, 2.0.3, 2.0.4, 2.1.0, 2.1.1 Cloud only, 2.2.0 Cloud only, 2.2.1, 2.2.3 Cloud only, 2.2.4, 2.2.5

 Download manual
Feedback submitted, thanks!