Detect Numeric Outliers
The Detect Numeric Outliers assistant determines values that appear to be extraordinarily higher or lower than the rest of the data. Identified outliers are indicative of interesting, unusual, and possibly dangerous events. This assistant is restricted to one numeric data field.
Algorithm
- Distribution statistics (standard deviation, median absolute deviation, interquartile range)
Workflow
To detect a numerical outlier, you input data and select the parameters to look for. When expectations are violated, the result is an outlier. The basic steps are as follows:
- Enter a search to retrieve your data, then click the search button to run it.
- Select the field you want to analyze. This list of fields is populated by the search you just ran.
- Select a value for threshold method. Select a method based on the distribution of the data and the impact you'd like outliers to have. Select Standard Deviation if your data is normally distributed and you don't mind outliers having a big impact on the outlier threshold. Otherwise, if you want more robustness to outliers, try the other methods.
- Specify a value for threshold multiplier. The larger the number, the larger the outlier envelope (and therefore, the fewer the outliers).
- Select whether or not to use a sliding window and specify the number of values to use to compute each slice of the outlier envelope. Otherwise, if you don't specify a sliding window, the envelope is computed using the entire dataset at once, therefore creating an outlier envelope with a uniform size.
- Click Detect Outliers.
Interpret and validate
After you fit the model, review the visualizations to see how many outliers are identified. The expectation is to have a few outliers.
- Outliers: Shows the number of events flagged as outliers.
- Total Events: Shows the total number of events that were evaluated.
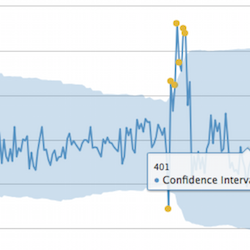
- Outliers chart: Displays a graph of values, where values that fall outside of the blue envelope are denoted by a yellow dot (the outliers). Hover over a dot to display the value and quantity of the outlier. Click the dot to drill down and display a search query that shows the base data of the point. When the point is an outlier, you can learn more about the nature of the outlier point.
- Data and Outliers: Displays a table of the outliers and their values.
Deploy outlier detection
Once you have detected outliers, you can take the following actions:
- Click the Open in Search button next to the Detect Outliers button to open a new Search tab, filled out with a search query that uses all data (not just the training set).
- Click the Show SPL button next to the Open in Search button to see the search query that was used to detect outliers. For example, you could use this same query on a different data set.
- Click the Schedule Alert button in a panel to set up an alert to detect when the number of outliers exceeds a certain value. After you save the alert, you can access it from the Scheduled Jobs > Alerts menu.
- Click any title to go to a new Search tab, filled out with a search query to replicate the outlier detection calculations.
| Predict Categorical Fields | Detect Categorical Outliers |
This documentation applies to the following versions of Splunk® Machine Learning Toolkit: 1.3.0, 2.0.0

 Download manual
Feedback submitted, thanks!