Search macros in the Machine Learning Toolkit
The Machine Learning Toolkit (MLTK) ships with several search macros. Search macros are reusable blocks of Search Processing Language (SPL) that you can insert into other searches. Search macros can be any part of a search, such as an eval statement or search term and do not need to be a complete command. You can also specify whether the macro field takes any arguments.
Use these macros to save time writing common SPL queries and to validate models:
View the MLTK search macros
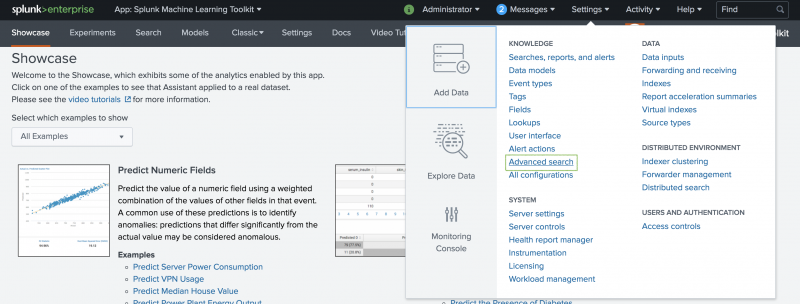
You can view the available macros via the Settings drop down menu in the main Splunk navigation bar, and by selecting Advanced Settings.
On the resulting page, choose Search macros.
From the App menu, choose the Splunk Machine Learning Toolkit for MLTK search macros. Listed information includes the name, definition, and status. Search macros that take arguments are identified by a bracketed number following the name. For example, confusionmatrix(2) and regressionstatistics(2). Confusion matrix and regression statistics are the search macro names, each of which can take two (2) arguments.
Insert search macros into search strings
To include a search macro in your saved or ad hoc searches, place a back tick character ( ` ) before and after the macro name. You can also reference a search macro within other search macros using this same syntax.
For search macros that take arguments, define those arguments when you insert the macro into the search string. The following example shows a search macro with the arguments defined.
... | `classificationstatistics("DiskFailure", "predicted(DiskFailure)`
Classification statistics macro
Use the classification statistics macro to save time when measuring the statistics of your classification model.
Syntax
... | `classificationstatistics(response, prediction)`
Example
The following example shows the classification statistics macro on a test set. The first code block shows the passing of the fit command with the LogisticRegression algorithm.
| inputlookup disk_failures.csv | eventstats max(SMART_1_Raw) as max1 min(SMART_1_Raw) as min1 | eventstats max(SMART_2_Raw) as max2 min(SMART_2_Raw) as min2 | eventstats max(SMART_3_Raw) as max3 min(SMART_3_Raw) as min3 | eventstats max(SMART_4_Raw) as max4 min(SMART_4_Raw) as min4 | eventstats max(SMART_5_Raw) as max5 min(SMART_5_Raw) as min5 | eval SMART_1_Transformed = (SMART_1_Raw - min1)/(max1-min1) | eval SMART_2_Transformed = (SMART_2_Raw - min2)/(max2-min2) | eval SMART_3_Transformed = (SMART_3_Raw - min3)/(max3-min3) | eval SMART_4_Transformed = (SMART_4_Raw - min4)/(max4-min4) | eval SMART_5_Transformed = (SMART_5_Raw - min5)/(max5-min5) | table Date Model CapacityBytes SerialNumber DiskFailure SMART_1_Raw SMART_1_Transformed SMART_2_Raw SMART_2_Transformed SMART_3_Raw SMART_3_Transformed SMART_4_Raw SMART_4_Transformed SMART_5_Raw SMART_5_Transformed | fit LogisticRegression fit_intercept=true "DiskFailure" from "Model" "SMART_1_Transformed" "SMART_2_Transformed" "SMART_3_Transformed" "SMART_4_Transformed" "SMART_5_Transformed" into "example_disk_failures"
The second code block shows the passing of the apply command, followed by the macro.
| inputlookup disk_failures.csv | eventstats max(SMART_1_Raw) as max1 min(SMART_1_Raw) as min1 | eventstats max(SMART_2_Raw) as max2 min(SMART_2_Raw) as min2 | eventstats max(SMART_3_Raw) as max3 min(SMART_3_Raw) as min3 | eventstats max(SMART_4_Raw) as max4 min(SMART_4_Raw) as min4 | eventstats max(SMART_5_Raw) as max5 min(SMART_5_Raw) as min5 | eval SMART_1_Transformed = (SMART_1_Raw - min1)/(max1-min1) | eval SMART_2_Transformed = (SMART_2_Raw - min2)/(max2-min2) | eval SMART_3_Transformed = (SMART_3_Raw - min3)/(max3-min3) | eval SMART_4_Transformed = (SMART_4_Raw - min4)/(max4-min4) | eval SMART_5_Transformed = (SMART_5_Raw - min5)/(max5-min5) | table Date Model CapacityBytes SerialNumber DiskFailure SMART_1_Raw SMART_1_Transformed SMART_2_Raw SMART_2_Transformed SMART_3_Raw SMART_3_Transformed SMART_4_Raw SMART_4_Transformed SMART_5_Raw SMART_5_Transformed | apply "example_disk_failures" | `classificationstatistics("DiskFailure", "predicted(DiskFailure)")`
Example output
Classification report macro option
You have the option to view the classification statistics results by class using the classification report macro. The classification report macro gives you the weighted average for each of the classification statistics classes.
Example output
Confusion matrix macro
Use the confusion matrix macro to save time when assessing the performance of your classification model.
Syntax
... | `confusionmatrix(response, prediction)`
Example
The following example shows the confusion matrix macro on a test set. The first code block shows the passing of the fit command with the LogisticRegression algorithm.
| inputlookup diabetes.csv
| sample partitions=3 seed=42
| search partition_number < 2
| fit LogisticRegression response from BMI age into LogisticRegressionClassifier
The second code block shows the passing of the apply command, followed by the macro.
| inputlookup diabetes.csv
| sample partitions=3 seed=42
| search partition_number = 2
| apply LogisticRegressionClassifier as prediction
| `confusionmatrix(response, prediction)`
Example output
Classification report macro option
You have the option to view the confusion matrix results by class using the classification report macro. The classification report macro gives you the weighted average for each of the confusion matrix classes.
Example output
Regression statistics macro
Use the regression statistics macro to save time when measuring the statistics of your regression model.
Syntax
... | `regressionstatistics(response, prediction)`
Example
The following example shows the regression statistics macro on a test set. The first code block shows the passing of the fit command with the LinearRegression algorithm.
| inputlookup server_power.csv | fit LinearRegression fit_intercept=true "ac_power" from "total-unhalted_core_cycles" "total-instructions_retired" "total-last_level_cache_references" "total-memory_bus_transactions" "total-cpu-utilization" "total-disk-accesses" "total-disk-blocks" "total-disk-utilization" into "example_server_power"
The second code block shows the passing of the apply command, followed by the macro.
| inputlookup server_power.csv | apply "example_server_power" | `regressionstatistics("ac_power", "predicted(ac_power)")`
Example output
| Using the fit and apply commands | Custom visualizations in the Machine Learning Toolkit |
This documentation applies to the following versions of Splunk® Machine Learning Toolkit: 4.4.0, 4.4.1, 4.4.2, 4.5.0, 5.0.0, 5.1.0, 5.2.0, 5.2.1, 5.2.2, 5.3.0, 5.3.1


 Download manual
Feedback submitted, thanks!