User Behavior Overview
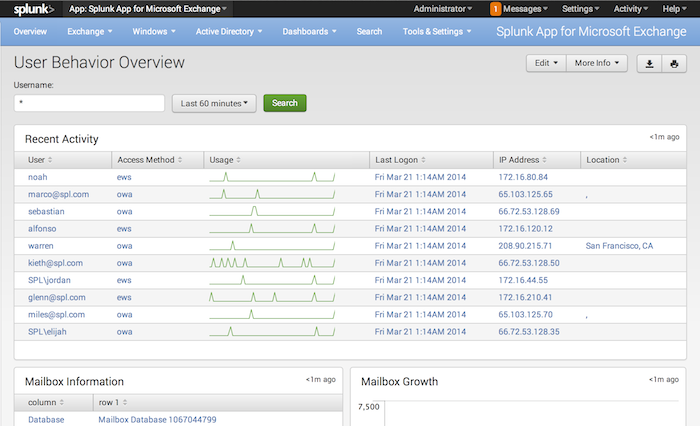
This page displays information about Exchange users' behavior within the Exchange network.
The page has several panels:
- The "Recent Activity" panel shows the users who have used the system most recently, and includes a usage sparkline and information on when they last logged on, what IP address they logged on from, and the geographical location of that IP address.
- The "Mailbox Information" and "Mailbox Growth" panels show information about mailbox databases and mailbox growth over time.
- The "Top Folders" panel shows information on the largest folders in the Exchange network, sorted by disk usage.
- The "Desktop Usage" and "Mobile OS Usage" panels show information on the top desktop and mobile operating systems, based on percentage of use.
- The "Browser Usage" panel shows browser usage, again based on percentage of use.
- Finally, the "Database History" panel shows the latest updates to the active Exchange mailbox databases, based on update time.
How to use this page
You can configure this page to filter to a specific user or set of users.
- To specify a user, enter that user's email address in the "Username" text box at the top of the page, set an appropriate time period using the time range picker, then click "Search".
- For each list panel, you can sort the contents by clicking on the column header button. Clicking more than once on the same column header toggles between ascending and descending sort based on that column.
- You can mouse over the line in the "Mailbox Growth" are chart to see individual data points for the chosen metric.
- You can click on any point in the chart to load the base search that produced the results for the chart at that time.
| Message Activity by Domain | Client Service Overview |
This documentation applies to the following versions of Splunk® App for Microsoft Exchange (EOL): 3.1.0, 3.1.1, 3.1.2, 3.1.3, 3.2.0, 3.2.1, 3.3.0

 Download manual
Feedback submitted, thanks!