Analyze a Host
This page gives you information about a specific host in your Exchange deployment.
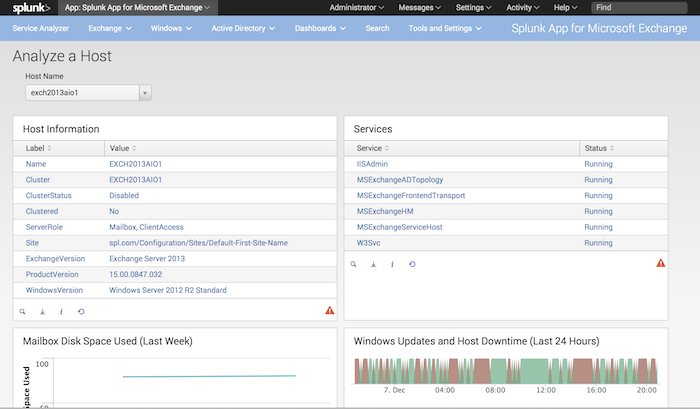
The page has five panels:
- The Host Information panel, which provides information about the host name, cluster status, Exchange server role, site, and version, and Windows version.
- The Services panel, which displays the state of installed Exchange-specific services.
- The Mailbox Disk Space Used chart, which displays information that correlates Exchange mailbox growth vs. disk space usage.
- The Windows Updates and Host Downtime chart, which displays a timeline of the chosen system's availability, as well as any Windows Update activity.
- The Services History chart, which shows the status of various services on a host.
How to use this page
- Select a host from the Host Name drop-down to update this page with information about that host.
- You can also search for a host by clicking the drop-down and entering a search string into the text entry box that appears. Only hosts whose names match the search string you enter display. Once you have found the host you want to see, click its name in the list.
- You can click on any of the entries in either panel to display the base search that produced this data.
- You can also export the results to a CSV, XML, or JSON file by clicking on the Export icon in the lower left corner of each dashboard panel.
| Host Overview | Analyze a Host Drive |
This documentation applies to the following versions of Splunk® App for Microsoft Exchange (EOL): 3.4.2, 3.4.3, 3.4.4, 3.5.0, 3.5.1, 3.5.2, 4.0.0, 4.0.1, 4.0.2, 4.0.3

 Download manual
Feedback submitted, thanks!