Troubleshoot the Splunk App for Microsoft Exchange
Is the Splunk App for Microsoft Exchange deployment correctly configured?
The first thing to check when Splunk App for Microsoft Exchange data is incomplete or incorrect is to confirm that the central Splunk instance is properly configured and receives data.
- Confirm that every indexer in the deployment has been configured to receive data. See Install and configure a Splunk Enterprise indexer for instructions.
- Confirm that every search head in the deployment has been configured to search all indexers. Search heads must search all available indexers to get all indexed data. See Configure distributed search in Distributed Search for specific instructions on configuring search heads and search peers (indexers).
- Confirm that you have installed and configured all of the pieces properly. Indexes that the Splunk App for Microsoft Exchange requires must be present on all indexers.
msexchangefor Exchange events.msad: for AD health metrics.winevents: for Directory Service, Replication Service, DNS server event logs.perfmon: for performance metrics.- Confirm that the Splunk App for Microsoft Exchange resides on all indexers and search heads in the deployment.
- Confirm that the Splunk Supporting Add-on for Active Directory (SA-ldapsearch) has been configured properly. See Configure the Splunk Supporting Add-on for Active Directory.
- Confirm that the Splunk Supporting Add-on for Active Directory resides on all search heads in the deployment. See "Troubleshoot issues with SA-LDAPsearch."
- Confirm that
eventtypes.conf(in%SPLUNK_HOME%\etc\apps\splunk_app_microsoft_exchange\local) has been configured with the proper indexes for the defined event types. Check for typos in the configuration file. - Confirm that the Splunk App for Microsoft Exchange lookup tables have been properly created. From the "Tools and Settings" menu, select "Build lookups".
- Confirm that PowerShell is available on all domain controllers and DNS Server hosts. See Configure PowerShell execution in Active Directory.
- Confirm that Group Policy objects to change audit policy are in place to enable local script execution. See "Configure Active Directory Audit Policy."
Troubleshoot issues with SA-LDAPsearch
To troubleshoot problems with the Splunk App for Microsoft Exchange and the Splunk Supporting Add-on for Active Directory version 3.0.1, see Troubleshoot the Splunk Supporting Add-on for Active Directory in the Splunk Supporting Add-on for Active Directory documentation.
To troubleshoot problems with version 3.0.1, see Troubleshoot the Splunk Supporting Add-on for Active Directory for version 3.0.1.
Windows event log or performance events from universal forwarders go to the 'main' index
When you install a universal forwarder on your Exchange server, do not select any options in the Enable Inputs screen of the installer. Doing so enables the scripted inputs that come with the forwarder by default. Those inputs send data to the "default" index as specified in their configuration files, which, on a standard Splunk Enterprise installation, is main.
After you install the universal forwarder onto your exchange server, deploy the appropriate add-ons for Windows, Active Directory, Windows DNS, or Exchange to ensure that the data those add-ons collect goes to the correct index.
If you're using TA-Windows version 6.0.0 or later, you don't need TA_AD and TA_DNS. TA_AD and TA_DNS are merged with TA-Windows version 6.0.0.
No data types found after upgrade
If you experience a problem where the first-time run process detects no data after an upgrade, make sure that you add the exchange-admin role to the user that runs the app.
- From Splunk Web, click Settings.
- In the window that pops up, under "Users and Authentication", click Access Controls. Splunk Enterprise loads the "Access Controls" page.
- Click Users. Splunk Enterprise loads the "Users" page.
- In the Username column, click the name of the user that runs the Splunk App for Microsoft Exchange. Splunk Enterprise loads the settings page for that user.
- Scroll down to Assign to roles.
- Add the
exchange-adminrole to the Selected roles pane by clicking on its entry in the Available roles pane. - Click Save. Splunk Enterprise saves the changes and returns you to the Users page.
Dashboards do not populate due to errors with PowerShell modules
If you run Exchange Server 2010 with Service Pack 2, you might experience an issue where dashboards do not populate because of errors with PowerShell. This owes to a bug that occurs when you apply Exchange Server 2010 SP2. This is a problem with Exchange Server and not with the Splunk software.
To fix the problem, follow the instructions at "Microsoft.Exchange.Management.PowerShell.E2010 is not installed on this machine" on MS TechNet Blogs.
Dashboards fail to load after upgrading the app or Splunk Enterprise
If you experience a problem where some dashboard panels or menus fail to load after you upgrade either Splunk Enterprise or the Splunk App for Microsoft Exchange, clear your web browser cache, log out of Splunk Enterprise, then log back in.
The Service Analyzer page displays errors after an upgrade
If you experience errors in the Service Analyzer after upgrading the Splunk App for Microsoft Exchange, confirm that the new data model has built successfully.
Service analyzer dashboard and Exchange Overview dashboards are not populating
These dashboards won't populate if the data model acceleration isn't enabled. See Enable data model acceleration to enable data model acceleration for the "MSExchange_Messaging" and "Microsoft_Exchange" data models.
Check data model build progress
To check the status of the new Microsoft Exchange data model, follow this procedure:
- Log into Splunk Enterprise on a search head in the deployment.
- In the system bar, click Settings > Data Model. Splunk Enterprise loads the "Data Models" page.
- In the entry for Microsoft Exchange click the caret to the left of the title.
- Review the status under Acceleration. The status says "100% complete" when it has finished. Otherwise, it says "Building."
- Wait until the status says "100% complete" before using the app. After an upgrade, this process could take a while.
Disable Transport Handling and Mailbox components in Service Analyzer for Exchange Server 2007 and Server 2010 environments
Fix an issue where tiles in the Service Analyzer and Service Health pages spuriously appear as red when the Splunk App for Microsoft Exchange monitors an Exchange Server 2007 or Exchange Server 2010 environment.
Symptoms
When you visit the Service Analyzer page, the "Mailbox" and "Transport Handling" tiles appear red/in a "Critical/Error" state, even though no data is present that warrants the services appear in such a state.
Cause
In Exchange Server 2007 and 2010, the Mailbox and Hub Transport roles were separate and had their own set of exclusive Windows services. In Exchange Server 2013, the Hub transport role was merged with the Mailbox role.
By default, Service Analyzer shows all of the components for both roles in the Hub Transport and Mailbox services. This means that if you have an Exchange Server 2007 or Exchange Server 2010 environment, you will see red components for those services.
Workaround
To fix this, use the configure components page to disable the following components for your Exchange Server 2007 and 2010 hosts:
| Transport Handling role | Mailboxes role |
|---|---|
|
|
This problem only appears on Windows systems.
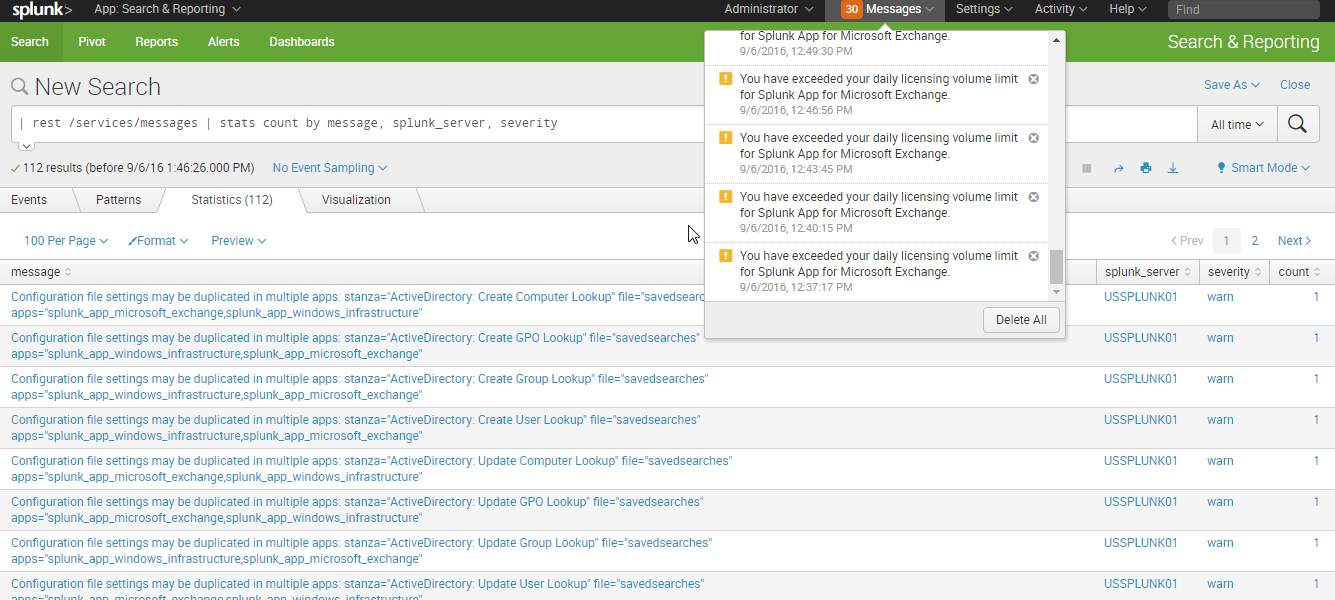
Exchange app installed on same search head as the Splunk App for Windows Infrastructure
Your deployment receives the following error.
Configuration file settings may be duplicated in multiple apps: stanza="ActiveDirectory: Create Computer Lookup" file="savedsearches" apps="splunk_app_microsoft_exchange,splunk_app_windows_infrastructure"
This error happens when the Splunk App for Windows Infrastructure and the Splunk App for Microsoft Exchange are installed on the same search head. The Splunk App for Windows Infrastructure and the Splunk App for Microsoft Exchange contain identical knowledge objects that cause a conflict when installed on the same search head deployment.
Removing either the Splunk App for Windows Infrastructure or the Splunk App for Microsoft Exchange will resolve this issue.
Lookup errors on all searches for WinEventLog:System:IAS and source:::Security' If running splunk_app_microsoft_exchange v3.5.0 with Splunk_TA_windows 4.8.4.
This section is for troubleshooting lookup errors on all searches for WinEventLog:System:IAS and source:::Security.
If you experience the following search errors on UI while running splunk_app_microsoft_exchange v3.5.0 with the Splunk_TA_windows 4.8.4, then remove windows_apps lookup and its transforms definition from Splunk App for Microsoft Exchange.
Error 'Could not find all of the specified lookup fields in the lookup table.' for conf 'source::*:Security' and lookup table 'windows_app_lookup'.
Remove windows_apps.csv lookup from main app.
- Remove
windows_appslookup from/etc/shcluster/apps/splunk_app_microsoft_exchange/lookupson the searchhead deployer (In case of standalone searchhead, remove it from/etc/apps/splunk_app_microsoft_exchange/lookups). - Remove following
windows_appslookup definition from/etc/shcluster/apps/splunk_app_microsoft_exchange/default/transforms.confon the searchhead deployer (In case of standalone searchhead, remove it from/etc/apps/splunk_app_microsoft_exchange/default/transforms.conf). - Push bundle from deployer to SHs.
- *In case of standalone searchhead, restart Splunk on SH.
[windows_app_lookup]
filename = windows_apps.csv

[windows_apps]
filename=windows_apps.csv
max_matches=1
Dashboard gives 404 after an upgrade
If the dashboard returns a 404 error after the upgrade, there was a file name change. Perform the following steps:
- Clear the cache from your browser.
- Open "http://<ip>:<port>/en-US/_bump" in your respective browser and click on the bump button.
- Open "http://<ip>:<port>/en-US/debug/refresh" in your respective browser and click on the Refresh button.
- Go to the Splunk Home Page "http://<ip>:<port>".
- Run the
upgradescriptcommand in the Search & Reporting app. After successfully running the command, you will see "upgrade script completed successfully".
The following Splunk search returns upgradescript command result:| upgradescript
After successfully running the above command, this output should appear:
messages
---------------------------------------
upgrade script completed successfully
- Perform a Rolling Restart on the search head.
- Once the apps are pushed successfully, run the guided setup again on any of the search heads.
- Enable the acceleration for data models "Microsoft Exchange" and "MSExchange Messaging".
| Dashboard reference: Build custom dashboards | Best practices guide |
This documentation applies to the following versions of Splunk® App for Microsoft Exchange (EOL): 4.0.4


 Download manual
Feedback submitted, thanks!