Dashboard reference for the Splunk Supporting Add-on for VMware
Capacity Planning (Hosts)
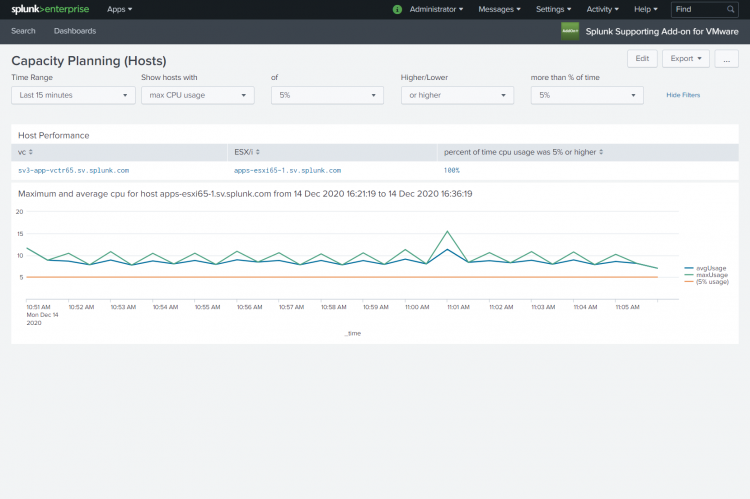
Use the Capacity Planning (Hosts) dashboard to monitor and plan the allocation of resources to hosts in your environment. This dashboard shows the performance of hosts, over time, based on the memory or cpu resources used. These resources are critical components of your virtual infrastructure.
Looking at this dashboard you can see the performance of hosts for the specific metric selected. Using the data provided you can provision your hosts and virtual machines with the correct amount of physical memory and cpu resources.
The Splunk Supporting Add-on for VMware uses VMware's key performance counters to determine the memory and cpu resource demands of the hosts.
Host Performance
You can generate a report to monitor the performance of hosts based on cpu or memory usage. In the Capacity Planning (Hosts) dashboard create a search using the drop-down lists on the dashboard.
To show host performance:
- Select a time range for the search, for example Last 24 hours.
- In the Show Hosts with drop-down list, select a key performance metric, max cpu usage or max memory usage, on which to base the search. For example, max cpu usage.
- Define a usage percent for a resource, for example 70%.
- Specify whether you want the search to include results that are higher or lower that the percent specified (in the next step). In this example select or higher.
- Define a percentage of time over which the resource is used, for example 5%.
A results table shows host performance for all hosts for which max_cpu_usage was 70% or higher more than 5% of the time.
Chart performance
Click on a host in the results table to chart the individual host performance. The average and maximum usage for the performance category (mem or cpu) for the host is displayed in relation to the threshold you defined.
Metrics used to populate the dashboard
| Name | Metric | Description |
|---|---|---|
| max cpu usage | cpu.average.usage.percent | This is the Esxi host's average memory usage as a percent value. |
| max memory usage | mem.average.usage.percent | This is the Esxi host's average memory usage as a percent value. |
Capacity Planning (Clusters)
Use the Capacity Planning (Clusters) dashboard to monitor and plan the allocation of resources for virtual machines in your cluster. Using this dashboard you can see memory and cpu utilization for specific clusters, and you can identify those clusters that are nearing maximum capacity for the specific resource. CPU utilization is expressed as a percentage of time (0 to 100%) that the CPU executes at the threshold you define.
You can also view a list of clusters excluded due to lack of hosts or services. These are clusters that do not support cluster services and that contain less than two hosts.
Cluster Performance
Filter your search results using the drop-down lists in this panel. The data displayed in the table is populated with the results of the search. Using the results in the table you can monitor the activity of certain clusters or better provision resource (cpu or memory) for them.
To show cluster performance:
- Select a time range for the search, for example Last 24 hours.
- In the Show clusters with drop down, select a key performance metric, max cpu usage or max memory usage, on which to base the search. For example, max cpu usage.
- Define a usage percent for a resource, for example 80%.
- Specify whether you want the search to include results that are higher or lower that the percent specified (in the next step). In this example select "or higher".
- Define a percentage of time over which the resource is used, for example 5%.
A table displays the clusters where cpu usage met or rose above 80% more than 5% of the time.
Chart cluster performance
Click on a cluster in the results table to display a chart showing the performance of the cluster in relation to the threshold you set for that metric.
Metrics used to populate the dashboard
| Name | Metric | Description |
|---|---|---|
| max cpu usage | clusterServices.average.effectivecpu.megaHertz | This is the Esxi host's average memory usage as a percent value. |
| max memory usage | mem.average.usage.percent | This is the Esxi host's average memory usage as a percent value. |
Capacity Planning for Clusters - CPU Headroom
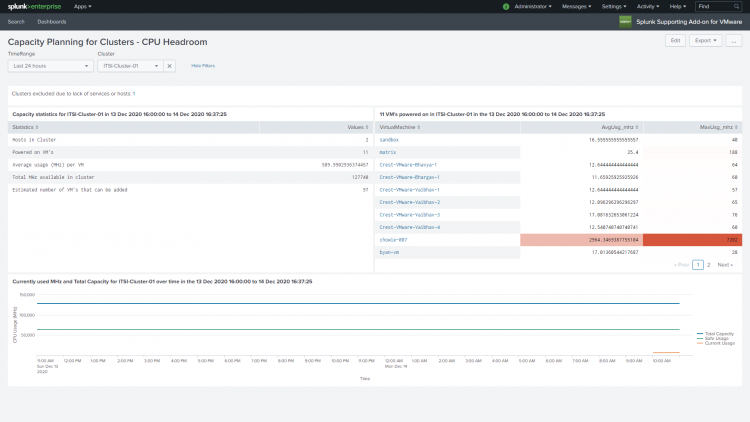
Use this dashboard to get an estimate for the number of virtual machines that you can add to the cluster based on current cpu consumption (of the ESXi hosts) and total cpu capacity allocated to virtual machines in the cluster. This dashboard reports only on powered-on virtual machines in the cluster.
The Capacity Planning for Clusters - CPU Headroom dashboard displays:
- Capacity statistics for a cluster.
- A list of powered-on virtual machines showing their cpu usage in the cluster.
- A chart showing current cpu usage, safe cpu usage, and total cpu capacity for the cluster.
You can view a list of clusters excluded due to lack of hosts or services. These are clusters that do not support cluster services and that contain less than two hosts.
To display details for a specific cluster, select a time range and the cluster name from the Cluster drop-down list. Details for the cluster are displayed in the panels.
Capacity statistic
In the Capacity statistics panel you can see:
- The number of hosts in the cluster
- The number of powered on virtual machines
- Average CPU usage in (MHz) per virtual machine.
- Total CPU usage MHz available in cluster
- Estimated number of virtual machines that can be added to the cluster
Powered on virtual machines in the cluster
A table displays the powered on virtual machines in the cluster and the average and maximum cpu usage (in MHZ) for each virtual machine.
Currently used (MHz) and Total Capacity
A chart displays the total capacity of the cluster, the current cpu usage of the cluster, and safe usage over the time period specified.
Metrics used
The following metrics are used to calculate CPU utilization:
- cpu usage for the cluster is calculated based on clusterServices.average.effectivecpu.megaHertz
- Average cpu usage (MHz) is calculated based on cpu.average.usagemhz.megaHertz
- Maximum cpu usage (MHz) is calculated based on cpu.maximux.usagemhz.megaHertz
- Minimum cpu usage (MHz) is calculated based on cpu.minimum.usagemhz.megaHertz
Capacity Planning for Clusters - Memory Headroom
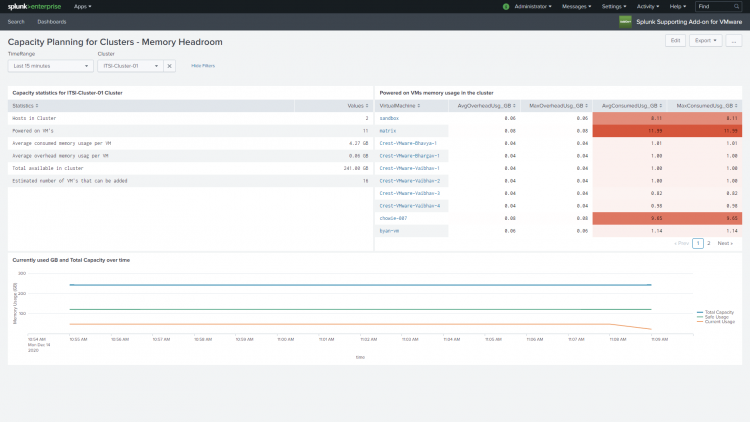
Use this dashboard to get an estimate for the number of virtual machines that you can add to the cluster based on current memory consumption and overhead memory allocated to the virtual machines in the cluster. This dashboard reports only on powered-on virtual machines in the cluster.
Using the data on this dashboard you can make better resource provisions to minimize and resolve bottlenecks, increases the availability of systems and improve overall performance of the systems.
The Capacity Planning for Clusters - Memory Headroom dashboard displays:
- Capacity statistics for the cluster.
- A list of powered-on virtual machines showing their memory usage in the cluster.
- A chart showing current memory usage (in GB) for the cluster, and total memory capacity for the cluster
Dashboard Panels
To display details for a specific cluster, select a time range and the cluster name from the Cluster drop-down list. The details for the cluster are displayed in the panels.
Capacity statistic
Look on the Capacity statistics panel for information about:
- The number of hosts in the cluster.
- The number of powered-on virtual machines.
- Average consumed memory (in GB) per virtual machine.
- Average overhead memory usage (in GB) per virtual machine.
- Total memory available in the cluster (in GB).
- Estimated number of virtual machines that you can add to the cluster.
Powered on virtual machines memory usage in the cluster
Look on this panel to see the memory usage for each powered-on virtual machines in the cluster. Virtual machine memory overhead is the amount of machine memory allocated to a virtual machine beyond its reserved amount.This table shows the average and maximum overhead usage (in GB) for each virtual machine.
- AvgOverheadUsg_GB is the metric used to measure the memory used by VMware to actually power the virtual machine.
- MaxOverheadUsg_GB is the metric used to measure the maximum memory used by VMware to actually power the virtual machine, over the summarization period.
- AvgConsumedUsg_GB is the metric used to measure the average memory consumed by the virtual machine in the cluster.
- MaxConsumedUsg_GB is the metric used to measure the maximum amount of memory consumed by a virtual machine over the summarization period.
Currently used (GB) and Total Capacity
A chart displays the total capacity of the cluster, the current cpu usage of the cluster, and safe usage over the time period specified.
Capacity Forecasting
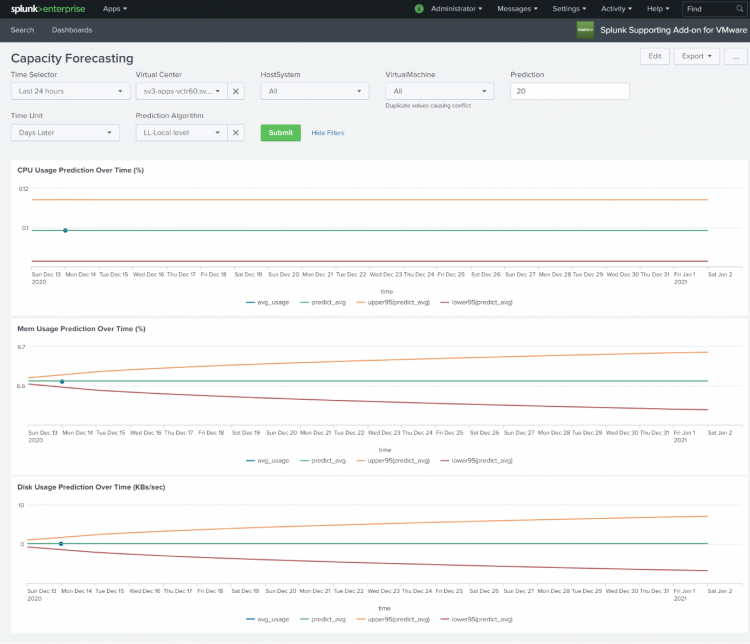
Use capacity forecasting to predict resource usage for different entities in your environment. Predicted results are based on historical values. Using these predictions you can optimize your environment for peak performance and be prepared, in advance, to handle unexpected usage periods.
Using the Capacity Forecasting dashboard, you can:
- Predict cpu usage over a specified time.
- Predict memory usage over time.
- Predict disk usage over time.
Use the drop-down lists to filter your selection for charting predicted resource usage. You can:
- Select a time range for the search using the Time Selector.
- Select a specific virtual center in your environment.
- Select all host systems managed by the virtual center or select a specific host system.
- Select all virtual machines or select a specific virtual machine.
- Set a prediction time. A value of "0" indicates current time. A value of "1" indicates that you want to predict resource usage for 1 "time unit" from now.
- Select a time unit, for example, minutes, days, weeks, or months into the future.
- Select a forecasting algorithm. The prediction algorithms are:
- LLP-Seasonal local level - This is a univariate model with seasonality. The periodicity of the time series is automatically computed. It requires the minimum number of data points to be twice the period.
- LL-Local level - This is a univariate model with no trends and no seasonality. It requires a minimum of 2 data points.
- LLT-Local level trend - This is a univariate model with trend but no seasonality. It requires a minimum of 3 data points.
For more information on the forecasting algorithms used, see "Predict" in the Splunk Enterprise Search Reference manual.
Capacity Forecasting Panel Description
The Capacity Forecasting dashboard charts predicted usage of a resource (cpu, memory, disk). In each of the charts on this dashboard, the lower and upper confidence interval parameters default to lower95 and upper95. This specifies a confidence interval where 95% of the predictions are expected to fall. The vmw:perf:* source type must be present for the panels to populate.
| Panel | Description |
|---|---|
| CPU Usage Prediction over Time (%) | The chart displays predicted cpu usage for a host system, or all of the host systems in a virtual center over the time range specified. CPU usage prediction is calculated as a percent value using the "cpu.average.usage.percent" metric. |
| Mem Usage Prediction over Time (%) | The chart displays predicted memory usage for a host system, or all of the host systems in a virtual center over the time range specified. Memory usage prediction is calculated as a percent value using the "mem.average.usage.percent" metric. |
| Disk Usage Prediction over Time (KBs/sec) | The chart displays predicted disk usage for a virtual machine or all the virtual machines in a virtual center over the time range specified. Disk Usage Prediction is calculated in KB/sec using the "disk.average.usage.kiloBytesPerSecond" metric. |
Virtual Machine Snapshots
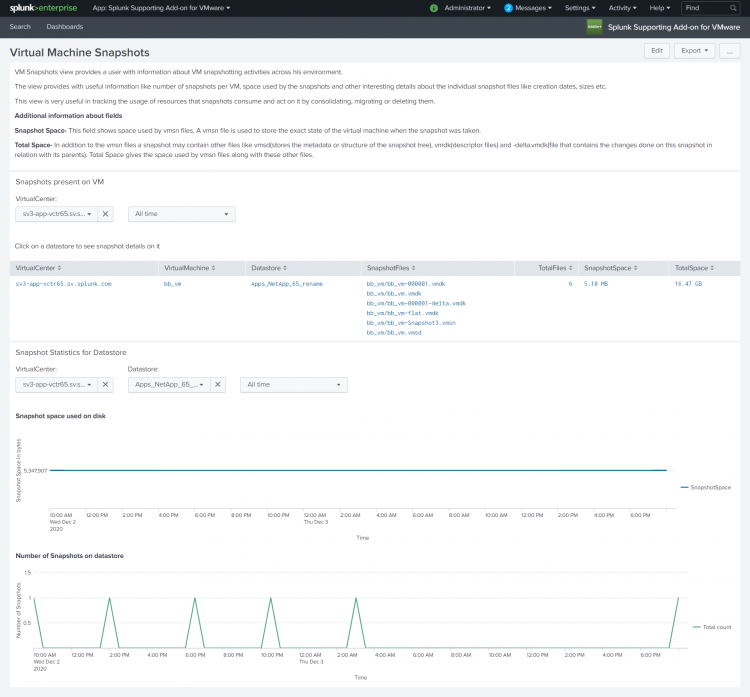
Use the Virtual Machine Snapshots dashboard to get information about snapshotting activities for virtual machines in your environment. Act on the data by consolidating, migrating, or deleting the snapshots.
On the Virtual Machine Snapshots dashboard, you can:
- See the number of snapshots per virtual machine.
- See the space used by the snapshots.
- Track the usage of resources that snapshots consume.
- Look at individual details about snapshot files such as file creation dates, file sizes, and so on.
The information displayed in each of the panels in the dashboard is determined by the selection you make in the drop-down lists.
Snapshots present on VM
On this panel the resources consumed by snapshots on the datastore are tracked. Look at the information in this view to see whether snapshot behavior has an impact on your overall environment. You can decide whether you want to make changes to the snapshot activity in your environment.
Use the drop-down lists to select a virtual center and a time range over which you want to examine snapshot activity.
| Field | Description |
|---|---|
| Virtual Center | The name of the virtual center. |
| Virtual Machine. | The name of the virtual machine. |
| Datastore | The name of the datastore. Click on the datastore to drill down and see the snapshot details on it. |
| SnapshotFiles | The names of the files in the snapshot. |
| TotalFiles | The total number of snapshot files. |
| SnapshotSpace | The space used by vmsn (VMware snapshot) files. A vmsn file is used to store the exact state of the virtual machine when the snapshot was taken. |
| TotalSpace | A snapshot contains vmsn files along with other files. TotalSpace is the space used by vmsn files in addition to the space used by the following files:
|
Snapshot Statistics for Datastore
In this panel, use the drop-down lists to select a virtual center, a datastore, and a time range over which you want to examine snapshot activity.
| Field | Description |
|---|---|
| Snapshot space used on disk | The chart displays the snapshot space (in bytes) used on the disk over the time range selected. |
| Number of Snapshots on datastore | The chart displays a count of the number of snapshots on the data store over the selected time range. |
| Get started with the Splunk Supporting Add-on for VMware | Troubleshoot the Splunk Supporting Add-on for VMware |
This documentation applies to the following versions of Splunk® Supporting Add-on for VMware: 1.0.0, 1.0.1

 Download manual
Feedback submitted, thanks!