Configure inputs in Splunk Infrastructure Monitoring Add-on
The Splunk Infrastructure Monitoring Add-on contains a modular input called Splunk Infrastructure Monitoring Data Streams. The input uses Splunk Infrastructure Monitoring SignalFlow computations to stream metrics from Infrastructure Monitoring into Splunk using a long-standing modular input job. You can use this metrics data in Splunk apps with a persistent cache and query mechanism.
Consider creating inputs if you require a consistent flow of data into the Splunk platform. For example, you might have saved searches in ITSI that are scheduled to run at a certain interval. In this case, consider leveraging the modular input to avoid creating jobs multiple times and potentially stressing the Splunk platform. Inputs should be configured on a data collection node which is usually a heavy forwarder.
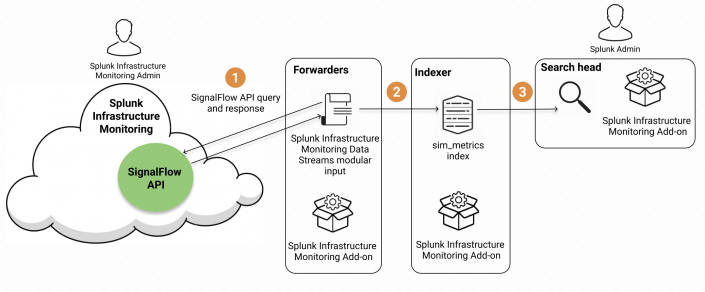
The following diagram illustrates how the modular input queries the Infrastructure Monitoring SignalFlow API and receives a streaming response. The forwarder then sends that data directly to the sim_metrics index where you can query it from the Splunk search head. The amount of data ingested into the sim_metrics index doesn't count towards your Splunk license usage.
Prerequisites
For on-premises Splunk Enterprise deployments, install the add-on on universal or heavy forwarders to access and configure the modular input. For Splunk Cloud deployments, install the add-on on the Inputs Data Manager (IDM). For more information, see Install the Splunk Infrastructure Monitoring Add-on.
Configure the modular input
Perform the following steps on universal or heavy forwarders in a Splunk Enterprise environment, or on the IDM in a Splunk Cloud deployment.
- In Splunk Web, go to Settings > Data Inputs.
- Select modular input named Splunk Infrastructure Monitoring Data Streams.
- Select New.
- Configure the following fields:
| Field | Description |
|---|---|
| Name | A unique name that identifies the input. Avoid using "SAMPLE_" in the program name. Programs with a "SAMPLE_" prefix won't run unless manually enabled. |
| Organization ID | The ID of the organization used to authenticate and fetch data from Infrastructure Monitoring. If you don't provide an organization ID, the default account is used. |
| SignalFlow Program | A program consists of one or more individual data blocks equivalent to a single SignalFlow expression. See the structure and sample programs below. You can use the plot editor within the Infrastructure Monitoring Chart Builder to build your own SignalFlow queries. For instructions and guidance, see Plot metrics and events using Chart Builder in Splunk Observability Cloud in the Splunk Observability Cloud documentation. |
| Additional Metadata Flag | If 1, the metrics stream results contain full metadata. Metadata in Infrastructure Monitoring includes dimensions, properties, and tags. If not set, this value defaults to 0. For more information about metadata, see Metrics in Splunk Observability Cloud in the Splunk Observability Cloud documentation.
|
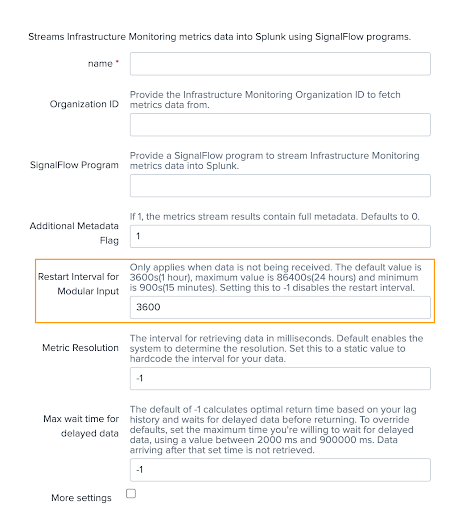
| Restart interval for modular input | Configure the timeout period for modular input if the SIM-TA has stopped collecting data. The default value is 3600s (1 hour). Maximum value is 86400s (24 hours) and the minimum value is 900s (15 minutes). For more information, see the Configure HeartBeat section of this topic. |
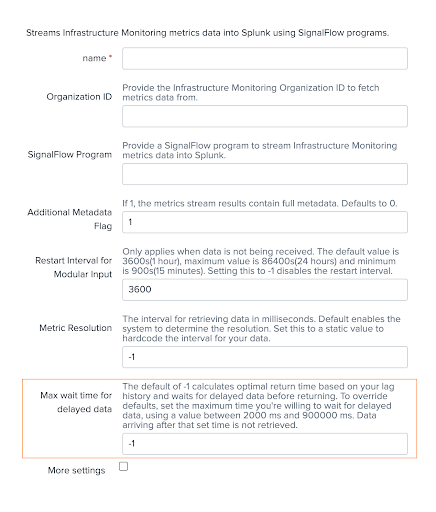
| Max wait time for delayed data | The default of -1 calculates optimal return time based on your lag history and waits for delayed data before returning. To override defaults, set the maximum time you're willing to wait for delayed data, using a value between 2000 ms and 900000 ms. Data arriving after that set time is not retrieved. For an explanation of how to configure this variable, see the Configure max wait time for delayed data section. For more information about the parameter, see the Kai sets a Max Delay for detectors to account for sudden changes in delay scenario in the Splunk Observability Cloud documentation. |
| Metric Resolution | The interval for retrieving data in milliseconds. Default setting enables the system to determine resolution. Set this to a static value to hardcode the interval for your data. For a description of how to configure the waiting time for delayed data, see the section "Configure max wait time for delayed data." For more information, see Data resolution and rollups in charts in the Splunk Observability Cloud documentation. |
Modular input structure
Each modular input program contains a series of computations separated by pipes. Within each computation is a series of data blocks that collect Infrastructure Monitoring data. The data blocks are separated by colons.
For better performance, divide the datablocks into multiple SignalFlow programs as per the nature of the data (metrics) being collected.
A program has the following structure:
"<<data-block>>;<<data-block>>;<<data-block>>;" | "<<data-block>>;<<data-block>>;" | "<<data-block>>;<<data-block>>;<<data-block>>;"
For example:
"data('CPUUtilization', filter=filter('stat', 'mean') and filter('namespace', 'AWS/EC2') and filter('InstanceId', '*'), rollup='average').publish(); data('NetworkIn', filter=filter('stat', 'sum') and filter('namespace', 'AWS/EC2') and filter('InstanceId', '*'), rollup='sum').publish(); data('NetworkOut', filter=filter('stat', 'sum') and filter('namespace', 'AWS/EC2') and filter('InstanceId', '*'), rollup='sum').publish();" An individual data block is equivalent to a single SignalFlow expression. A data block has the following structure:
data('CPUUtilization', filter=filter('stat', 'mean') and filter('namespace', 'AWS/EC2') and filter('InstanceId', '*'), rollup='average').publish();Best practices for gathering modular input
- All data blocks between pipes should have similar resolution and lag characteristics. Best practice is to query metrics with the same resolution. For example, you can create a query that matches the metric time series (MTS) that receives a datapoint every minute, and a separate query for MTS that receives a datapoint every 5 minutes.
- Avoid using wildcard expressions such as
cpu*to match many different metrics, because this increases the likelihood that metric queries will have different resolution and lag characteristics, which in turn would require you to set additional parameters to get expected behavior. - To understand the lag in your data, create a chart in Splunk Observability with the same metric you want to query in ITSI, and plot the lag rollup using
rollup='lag'in your SignalFlow program.
Configure max wait time for delayed data
Max Delay is a parameter of Analytics jobs. By default, the ideal Max Delay is automatically computed based on the historical delay of the data in the query. A statically configured Max Delay enables you to prevent Analytics from waiting for delayed data. You can configure using any value between 2000 ms and 900000 ms (2 seconds to 15 minutes). A message in the user interface notes the following:
The default of -1 calculates optimal return time based on your lag history and waits for delayed data before returning. To override defaults, set the maximum time you're willing to wait for delayed data, using a value between 2000 ms and 900000 ms. Data arriving after that set time is not retrieved.
What happens in the backend:
- If anything is configured above 900000 ms, the following log message displays:
The Max wait time for delayed data can have a maximum value of 900000ms, using 900000ms instead of Xms
- If anything is configured below 2000ms, the following log message displays:
The Max wait time for delayed data can have a minimum value of 20000ms, using 20000ms instead of Xms
Note: Expect a delay of a few seconds to pull metrics from Splunk Observability and ingest them in the index.
The following example of charting lag rollup shows a metric name of xyztest.sim_addon1, with a graph showing delayed datapoints for that metric over a time interval of between 0 and 2 minutes, as shown on the y (vertical) axis of the chart.
Configure HeartBeat
You can configure the timeout period (watchdog timer) for modular input if the SIM-TA has stopped collecting data. The timeout period can be configured for each individual input, and the minimum delay expected from signalFX is 15mins.
You may configure using any value. A message in the user interface notes the following: "Only applies when data is not being received. The default value is 3600s (1 hour), maximum value is 86400s (24 hours) and minimum is 900s (15 minutes). Setting this to -1 disables the restart interval."
What happens on the backend
- If anything is configured above 86400s, the following log message displays:
The Maximum value of Restart Interval for Modular Input can have is 86400s which is 24hrs, using 86400s for the restart instead of {sim_modinput_restart_interval_seconds}. - If anything is configured below 900s, the following log message displays:
The Minimum value of Restart Interval for Modular Input can have is 900s which is 15min, using 900s for the restart instead of {sim_modinput_restart_interval_seconds}. - Setting its configuration value to -1 disables the HeartBeat feature.
- The value of
Restart Interval for Modular Inputshould be greater than the value of Metric resolution.
Cleaning up the Backfill timestamp
If you purposely do not want to collect data over a specified interval, as in a scenario where you collect data for a few days and then decide that you won't need data for 10 days after that, you can disable input. In such a case, the modular-input script should not start fetching data from the Last timestamp (backfill) that was stored. To accomplish this, you delete the timestamp entry from the collection for the affected modular input. Use the modular input Cleanup_Disabled_Modinput_Data to remove backfill timestamp details.
Default cleanup is done every 1 hour, and you can disable modular input if you do not want to cleanup Backfill timestamps.
If the modular inputs are failing with the following error:
Computation failed ([{'code': 'ANALYTICS_JOB_MTS_LIMIT_HIT', 'context': {'jobId': 'XXXX',
'metadataCount': XXXX }}]),
then check the backfill timestamp of the modular input using the command below:
| inputlookup sim_modular_inputs_lookup
If the reason for ANALYTICS_JOB_MTS_LIMIT_HIT is the backfill timestamp value, then clean up the time stamps using Cleanup_Disabled_Modinput_Data Modular input.
How to remove the Backfill timestamp:
- Disable the modularinput for which you want to delete the timestamp
- Run the
`Cleanup_Disabled_Modinput_Data`mod input to cleanup the timestamp of the disabled input.
Note: if no backfill timestamps are present, the modularinput will fetch the data from current timestamp.
Sample programs
The following example programs give you a sense of how SignalFlow programs look and how you can use them. You can modify these programs and add them to your deployment, or create new ones using the examples as a template. For instructions to create a modular input, see Create modular inputs in the Developing Views and Apps for Splunk Web manual.
For more information about creating SignalFlow, see Analyze incoming data using SignalFlow in the Splunk Infrastructure Monitoring documentation.
Use a sample program
To use a sample program follow these steps:
- In Splunk Web, go to Settings > Data Inputs.
- Select modular input named Splunk Infrastructure Monitoring Data Streams.
- Select Clone for the sample program you want to use.
- Name your program. Avoid using "SAMPLE_" in the program name. Programs with a "SAMPLE_" prefix won't run unless manually enabled.
- Make any additional desired configurations.
- Select Save.
SAMPLE_AWS_EC2 input stream
The following program continuously pulls a subset of AWS EC2 instance data monitored by Splunk Infrastructure Monitoring into the Splunk platform:
"data('CPUUtilization', filter=filter('stat', 'mean') and filter('namespace', 'AWS/EC2') and filter('InstanceId', '*'), rollup='average').publish(); data('NetworkIn', filter=filter('stat', 'sum') and filter('namespace', 'AWS/EC2') and filter('InstanceId', '*'), rollup='sum').publish(); data('NetworkOut', filter=filter('stat', 'sum') and filter('namespace', 'AWS/EC2') and filter('InstanceId', '*'), rollup='sum').publish(); data('NetworkPacketsIn', filter=filter('stat', 'sum') and filter('namespace', 'AWS/EC2') and filter('InstanceId', '*'), rollup='sum').publish(); data('NetworkPacketsOut', filter=filter('stat', 'sum') and filter('namespace', 'AWS/EC2') and filter('InstanceId', '*'), rollup='sum').publish(); data('DiskReadBytes', filter=filter('stat', 'sum') and filter('namespace', 'AWS/EC2') and filter('InstanceId', '*'), rollup='sum').publish(); data('DiskWriteBytes', filter=filter('stat', 'sum') and filter('namespace', 'AWS/EC2') and filter('InstanceId', '*'), rollup='sum').publish(); data('DiskReadOps', filter=filter('stat', 'sum') and filter('namespace', 'AWS/EC2') and filter('InstanceId', '*'), rollup='sum').publish(); data('DiskWriteOps', filter=filter('stat', 'sum') and filter('namespace', 'AWS/EC2') and filter('InstanceId', '*'), rollup='sum').publish(); data('StatusCheckFailed', filter=filter('stat', 'count') and filter('namespace', 'AWS/EC2') and filter('InstanceId', '*'), rollup='sum').publish(); "
SAMPLE_AWS_Lambda input stream
The following program continuously pulls a subset of AWS Lambda data monitored by Splunk Infrastructure Monitoring into the Splunk platform:
"data('Duration', filter=filter('stat', 'mean') and filter('namespace', 'AWS/Lambda') and filter('Resource', '*'), rollup='average').publish(); data('Errors', filter=filter('stat', 'sum') and filter('namespace', 'AWS/Lambda') and filter('Resource', '*'), rollup='sum').publish(); data('ConcurrentExecutions', filter=filter('stat', 'sum') and filter('namespace', 'AWS/Lambda') and filter('Resource', '*'), rollup='sum').publish(); data('Invocations', filter=filter('stat', 'sum') and filter('namespace', 'AWS/Lambda') and filter('Resource', '*'), rollup='sum').publish(); data('Throttles', filter=filter('stat', 'sum') and filter('namespace', 'AWS/Lambda') and filter('Resource', '*'), rollup='sum').publish(); "
SAMPLE_Azure input stream
The following program continuously pulls a subset of Azure data monitored by Splunk Infrastructure Monitoring into the Splunk platform:
"data('Percentage CPU', filter=filter('primary_aggregation_type', 'true') and filter('aggregation_type', 'average'), rollup='average').promote('azure_resource_name').publish(); data('Network In', filter=filter('primary_aggregation_type', 'true') and filter('aggregation_type', 'total'), rollup='sum' ).promote('azure_resource_name').publish(); data('Network Out', filter=filter('primary_aggregation_type', 'true') and filter('aggregation_type', 'total'), rollup='sum').promote('azure_resource_name').publish(); data('Inbound Flows', filter=filter('primary_aggregation_type', 'true') and filter('aggregation_type', 'average'), rollup='average').promote('azure_resource_name').publish(); data('Outbound Flows', filter=filter('primary_aggregation_type', 'true') and filter('aggregation_type', 'average'), rollup='average').promote('azure_resource_name').publish(); data('Disk Write Operations/Sec', filter=filter('primary_aggregation_type', 'true') and filter('aggregation_type', 'average'), rollup='average').promote('azure_resource_name').publish(); data('Disk Read Operations/Sec', filter=filter('primary_aggregation_type', 'true') and filter('aggregation_type', 'average'), rollup='average').promote('azure_resource_name').publish(); data('Disk Read Bytes', filter=filter('primary_aggregation_type', 'true') and filter('aggregation_type', 'total'), rollup='sum' ).promote('azure_resource_name').publish(); data('Disk Write Bytes', filter=filter('primary_aggregation_type', 'true') and filter('aggregation_type', 'total'), rollup='sum').promote('azure_resource_name').publish();" | "data('FunctionExecutionCount', filter=filter('primary_aggregation_type', 'true') and filter('aggregation_type', 'total') and filter('is_Azure_Function', 'true'), rollup='sum').publish(); data('Requests', filter=filter('primary_aggregation_type', 'true') and filter('aggregation_type', 'total') and filter('is_Azure_Function', 'true'), rollup='sum').publish(); data('FunctionExecutionUnits', filter=filter('primary_aggregation_type', 'true') and filter('aggregation_type', 'total') and filter('is_Azure_Function', 'true'), rollup='sum').publish(); data('AverageMemoryWorkingSet', filter=filter('primary_aggregation_type', 'true') and filter('aggregation_type', 'average') and filter('is_Azure_Function', 'true'), rollup='Average').publish(); data('AverageResponseTime', filter=filter('primary_aggregation_type', 'true') and filter('aggregation_type', 'average') and filter('is_Azure_Function', 'true'), rollup='Average').publish(); data('BytesSent', filter=filter('primary_aggregation_type', 'true') and filter('aggregation_type', 'total') and filter('is_Azure_Function', 'true'), rollup='sum').publish(); data('BytesReceived', filter=filter('primary_aggregation_type', 'true') and filter('aggregation_type', 'total') and filter('is_Azure_Function', 'true'), rollup='sum').publish(); data('CpuTime', filter=filter('primary_aggregation_type', 'true') and filter('aggregation_type', 'total') and filter('is_Azure_Function', 'true'), rollup='sum').publish(); data('Http5xx', filter=filter('primary_aggregation_type', 'true') and filter('aggregation_type', 'total') and filter('is_Azure_Function', 'true'), rollup='sum').publish();"
SAMPLE_Containers input stream
The following program continuously pulls a subset of container data monitored by Splunk Infrastructure Monitoring into the Splunk platform:
"data('cpu.usage.total', filter=filter('plugin', 'docker'), rollup='rate').promote('plugin-instance', allow_missing=True).publish('DSIM:Docker Containers'); data('cpu.usage.system', filter=filter('plugin', 'docker'), rollup='rate').promote('plugin-instance', allow_missing=True).publish('DSIM:Docker Containers'); data('memory.usage.total', filter=filter('plugin', 'docker')).promote('plugin-instance', allow_missing=True).publish('DSIM:Docker Containers'); data('memory.usage.limit', filter=filter('plugin', 'docker')).promote('plugin-instance', allow_missing=True).publish('DSIM:Docker Containers'); data('blkio.io_service_bytes_recursive.write', filter=filter('plugin', 'docker'), rollup='rate').promote('plugin-instance', allow_missing=True).publish('DSIM:Docker Containers'); data('blkio.io_service_bytes_recursive.read', filter=filter('plugin', 'docker'), rollup='rate').promote('plugin-instance', allow_missing=True).publish('DSIM:Docker Containers'); data('network.usage.tx_bytes', filter=filter('plugin', 'docker'), rollup='rate').scale(8).promote('plugin-instance', allow_missing=True).publish('DSIM:Docker Containers'); data('network.usage.rx_bytes', filter=filter('plugin', 'docker'), rollup='rate').scale(8).promote('plugin-instance', allow_missing=True).publish('DSIM:Docker Containers');"
SAMPLE_GCP input stream
The following program continuously pulls a subset of Google Cloud Platform (GCP) data monitored by Splunk Infrastructure Monitoring into the Splunk platform:
"data('instance/cpu/utilization', filter=filter('instance_id', '*'), rollup='average').publish(); data('instance/network/sent_packets_count', filter=filter('instance_id', '*'), rollup='sum').publish(); data('instance/network/received_packets_count', filter=filter('instance_id', '*'), rollup='sum').publish(); data('instance/network/received_bytes_count', filter=filter('instance_id', '*'), rollup='sum').publish(); data('instance/network/sent_bytes_count', filter=filter('instance_id', '*'), rollup='sum').publish(); data('instance/disk/write_bytes_count', filter=filter('instance_id', '*'), rollup='sum').publish(); data('instance/disk/write_ops_count', filter=filter('instance_id', '*'), rollup='sum').publish(); data('instance/disk/read_bytes_count', filter=filter('instance_id', '*'), rollup='sum').publish(); data('instance/disk/read_ops_count', filter=filter('instance_id', '*'), rollup='sum').publish();" | "data('function/execution_times', rollup='latest').scale(0.000001).publish(); data('function/user_memory_bytes', rollup='average').publish(); data('function/execution_count', rollup='sum').publish(); data('function/active_instances', rollup='latest').publish(); data('function/network_egress', rollup='sum').publish();"
SAMPLE_Kubernetes input stream
The following program continuously pulls a subset of Kubernetes data monitored by Splunk Infrastructure Monitoring into the Splunk platform:
"data('container_cpu_utilization', filter=filter('k8s.pod.name', '*'), rollup='rate').promote('plugin-instance', allow_missing=True).publish('DSIM:Kubernetes'); data('container.memory.usage', filter=filter('k8s.pod.name', '*')).promote('plugin-instance', allow_missing=True).publish('DSIM:Kubernetes'); data('kubernetes.container_memory_limit', filter=filter('k8s.pod.name', '*')).promote('plugin-instance', allow_missing=True).publish('DSIM:Kubernetes'); data('pod_network_receive_errors_total', filter=filter('k8s.pod.name', '*'), rollup='rate').publish('DSIM:Kubernetes'); data('pod_network_transmit_errors_total', filter=filter('k8s.pod.name', '*'), rollup='rate').publish('DSIM:Kubernetes');"
SAMPLE_OS_Hosts input stream
The following program continuously pulls a subset of standard OS host data collected using the Splunk Infrastructure Monitoring Smart Agent:
"data('cpu.utilization', filter=(not filter('agent', '*'))).promote('host','host_kernel_name','host_linux_version','host_mem_total','host_cpu_cores', allow_missing=True).publish('DSIM:Hosts (Smart Agent/collectd)'); data('memory.free', filter=(not filter('agent', '*'))).sum(by=['host']).publish('DSIM:Hosts (Smart Agent/collectd)'); data('disk_ops.read', rollup='rate').sum(by=['host.name']).publish('DSIM:Hosts (Smart Agent/collectd)'); data('disk_ops.write', rollup='rate').sum(by=['host.name']).publish('DSIM:Hosts (Smart Agent/collectd)'); data('memory.available', filter=(not filter('agent', '*'))).sum(by=['host']).publish('DSIM:Hosts (Smart Agent/collectd)'); data('memory.used', filter=(not filter('agent', '*'))).sum(by=['host']).publish('DSIM:Hosts (Smart Agent/collectd)'); data('memory.buffered', filter=(not filter('agent', '*'))).sum(by=['host']).publish('DSIM:Hosts (Smart Agent/collectd)'); data('memory.cached', filter=(not filter('agent', '*'))).sum(by=['host']).publish('DSIM:Hosts (Smart Agent/collectd)'); data('memory.active', filter=(not filter('agent', '*'))).sum(by=['host']).publish('DSIM:Hosts (Smart Agent/collectd)'); data('memory.inactive', filter=(not filter('agent', '*'))).sum(by=['host']).publish('DSIM:Hosts (Smart Agent/collectd)'); data('memory.wired', filter=(not filter('agent', '*'))).sum(by=['host']).publish('DSIM:Hosts (Smart Agent/collectd)'); data('df_complex.used', filter=(not filter('agent', '*'))).sum(by=['host']).publish('DSIM:Hosts (Smart Agent/collectd)'); data('df_complex.free', filter=(not filter('agent', '*'))).sum(by=['host']).publish('DSIM:Hosts (Smart Agent/collectd)'); data('memory.utilization', filter=(not filter('agent', '*'))).promote('host',allow_missing=True).publish('DSIM:Hosts (Smart Agent/collectd)'); data('vmpage_io.swap.in', filter=(not filter('agent', '*')), rollup='rate').promote('host',allow_missing=True).publish('DSIM:Hosts (Smart Agent/collectd)'); data('vmpage_io.swap.out', filter=(not filter('agent', '*')), rollup='rate').promote('host',allow_missing=True).publish('DSIM:Hosts (Smart Agent/collectd)'); data('if_octets.tx', rollup='rate').scale(8).mean(by=['host.name']).publish('DSIM:Hosts (Smart Agent/collectd)'); data('if_octets.rx', rollup='rate').scale(8).mean(by=['host.name']).publish('DSIM:Hosts (Smart Agent/collectd)'); data('if_errors.rx', rollup='delta').sum(by=['host.name']).publish('DSIM:Hosts (Smart Agent/collectd)'); data('if_errors.tx', rollup='delta').sum(by=['host.name']).publish('DSIM:Hosts (Smart Agent/collectd)');"
Modular input sizing guidelines
Based on the size of your infrastructure, you might need to adjust the number of modular inputs you run to collect data. Infrastructure Monitoring imposes a limit of 250,000 MTS (metric time series) per computation. MTS is calculated as the number of entities you're monitoring multiplied by the number of metrics you're collecting.
You might also need to adjust the number of data blocks per computation to adhere to the data block metadata limit of 10,000 MTS, which is the default limit for standard subscriptions (the default limit for enterprise subscriptions is 30,000 MTS). The number of computations allowed in a single modular input depends on the number of CPU cores your Splunk instance contains, because each computation spins a separate thread. No more than 8-10 computations in a single modular input are recommended.
To write more efficient SignalFlow expressions, consider adding a rollup to your search so Infrastructure Monitoring doesn't bring in unnecessary statistics such as minimum, maximum, latest, and average for each metric. A rollup is a function that takes all data points received per MTS over a period of time and produces a single output data point for that period. Consider applying this construct to your search to ensure you only ingest the data you care about. For more information, see About rollups in the Data resolution and rollups in charts topic in the Splunk Observability Cloud documentation.
Troubleshoot Splunk Infrastructure Monitoring modular input
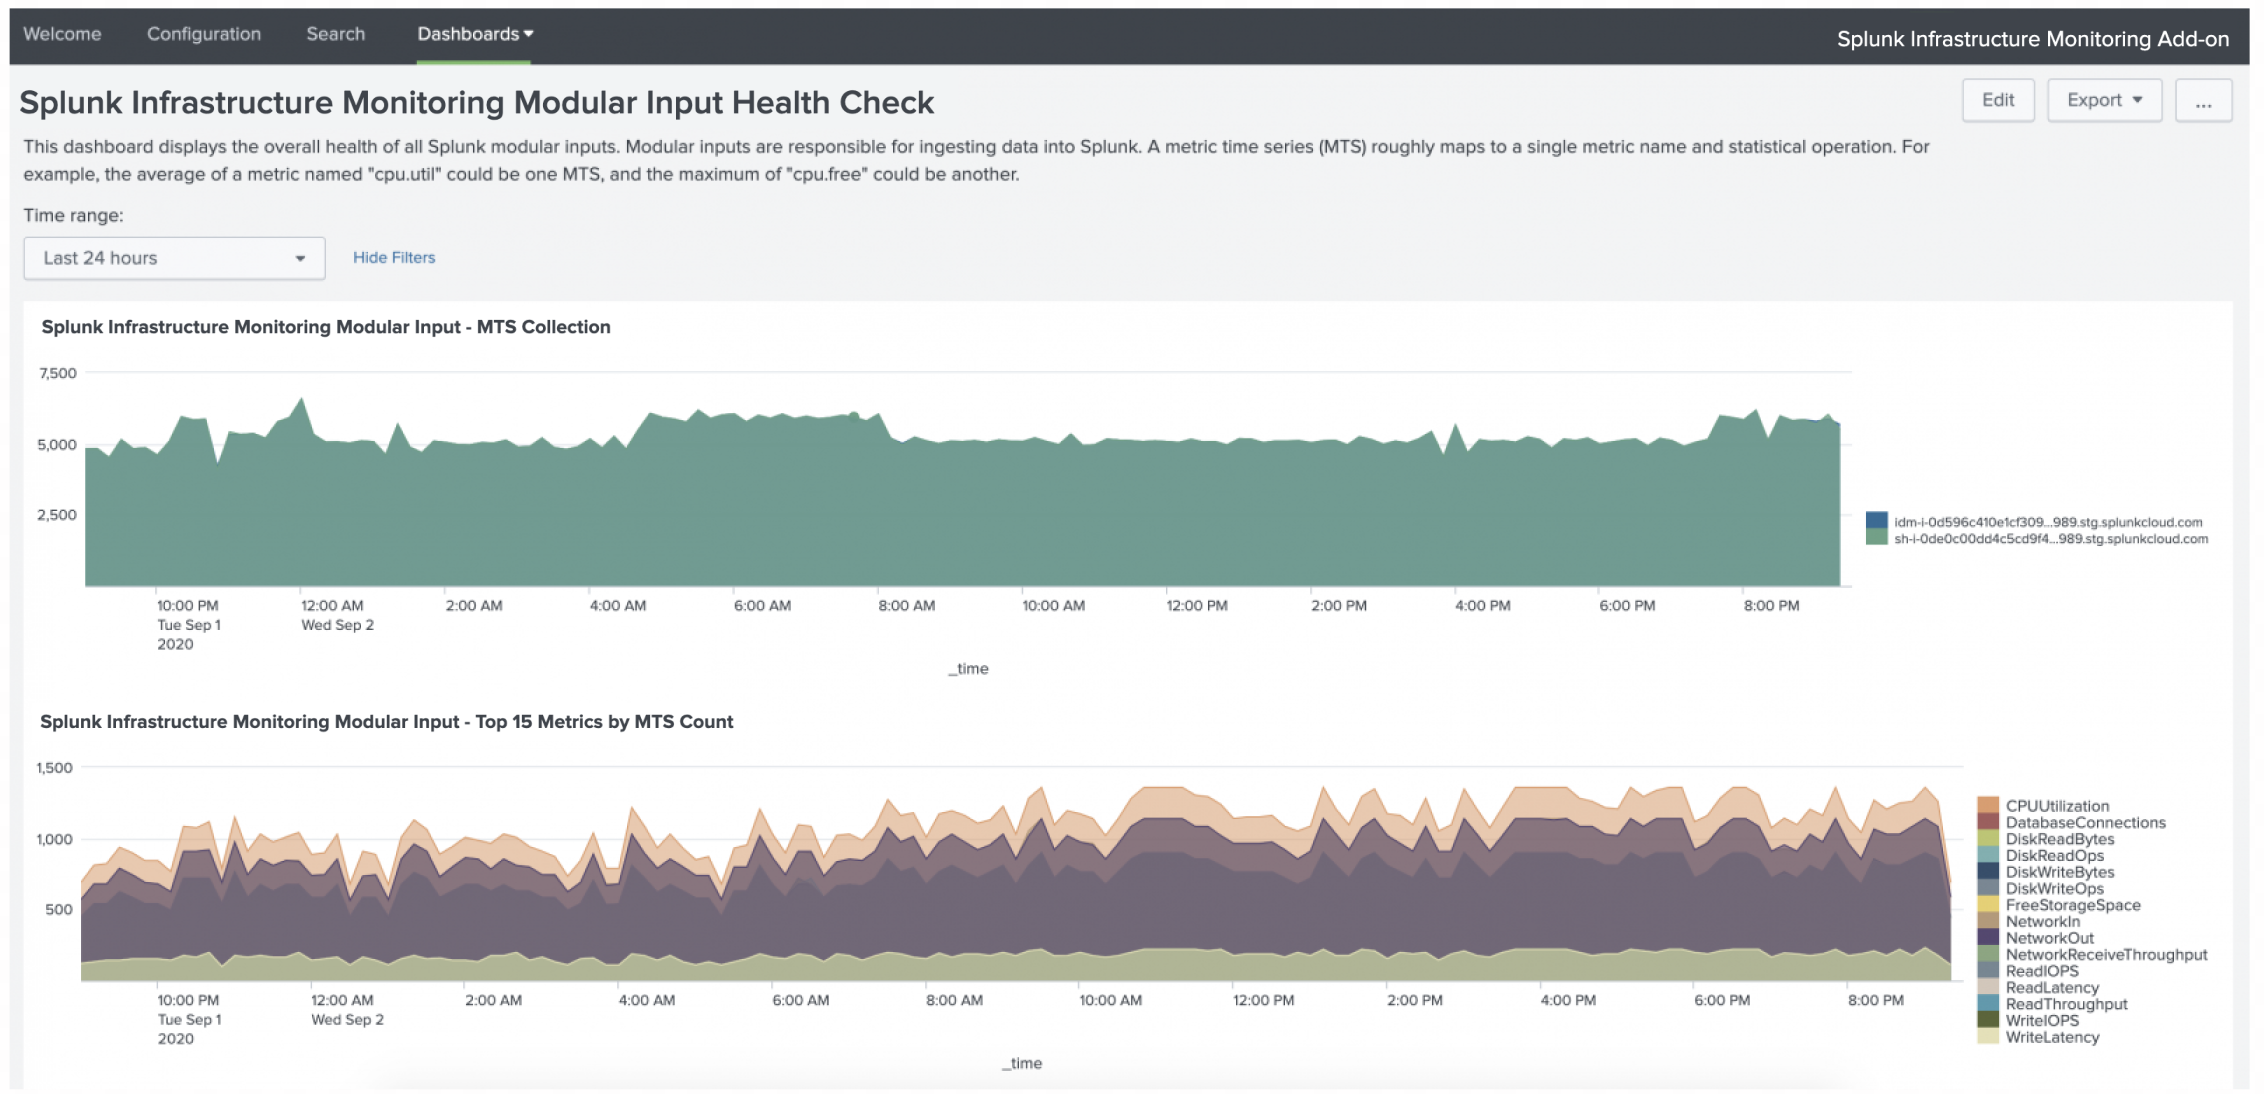
The Splunk Infrastructure Monitoring Add-on includes a health check and troubleshooting dashboard for the Infrastructure Monitoring modular input called Splunk Infrastructure Monitoring Modular Input Health Check. The dashboard provides information about the metric time series (MTS) being collected as well as instance and computation-level statistics.
| Configure Splunk Infrastructure Monitoring Add-on | About the sim command available with the Splunk Infrastructure Monitoring Add-on |
This documentation applies to the following versions of Splunk® Infrastructure Monitoring Add-on: 1.2.6, 1.2.7


 Download manual
Feedback submitted, thanks!