For details, see:
Monitor the health of your system
Use the System Health page to view a summary of your instance. The System Health page includes the following information:
- Running status of processes
- Resource consumption
- Health and status of critical processes
Use the System Health page as a starting point to begin troubleshooting issues. Splunk support might ask for the results of this page to start a troubleshooting investigation.
Perform the following tasks to get to the System Health page:
- From the main menu, select Administration.
- Select System Health > System Health.
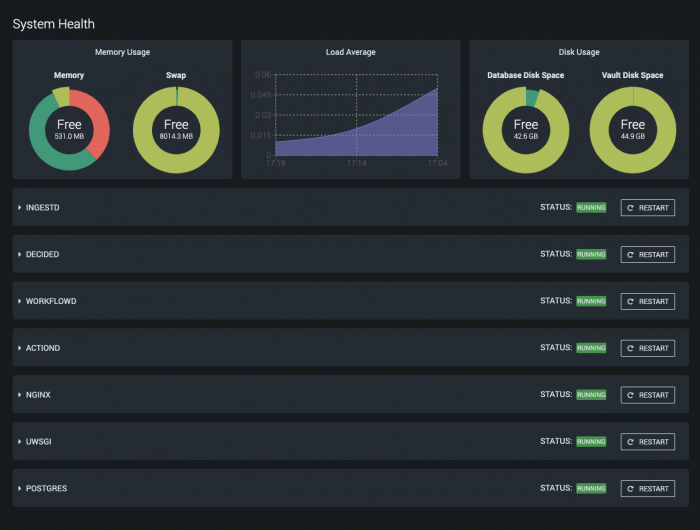
The following image shows the System Health page for a standalone, non-clustered instance. Additional selections such as a selector for individual nodes and ClusterD statistics are available on the System Health page in a clustered deployment. A clustered deployment doesn't have the Database Disk Space panel since the database in a cluster lives on a different host.
The top row of graphs shows you the status of the following system-wide resources:
- Memory usage
- Load average
- Disk usage
Each row after the top row represents the individual system processes important to . Verify that each process has a green Running status icon. Click Restart if you need to restart any one of the individual processes.
runs on top of Linux, so these graphs can be interpreted as you might on any Linux system. On a fairly idle system, there might be a significant amount of free memory, unused swap, and a lower load compared to the number of allocated CPU cores. There might also be more free disk space for the database and files.
The processing daemons IngestD, DecideD, WorkflowD, and ActionD perform various scheduling, decision, and management functions as well as critical background functions. All four must be running in order for to work properly. also relies on HTTPD and Postgres, which is the database.
If you registered a mobile device and Enable Mobile App is on, you can see the following behaviors in :
- The
ProxyDdaemon starts automatically. TheWatchdogDdaemon keeps track of the toggle switch position and adds or removes theProxyDdaemon from the system startup list depending on the status. - The System Health page also includes usage statistics for the
ProxyDdaemon. See Enable or disable registered mobile devices for information about the Enable Mobile App toggle.
| Enable or disable registered mobile devices | View how much data is ingested in using ingestion summary |
This documentation applies to the following versions of Splunk® SOAR (On-premises): 5.3.3, 5.3.4, 5.3.5, 5.3.6, 5.4.0, 5.5.0, 6.0.0, 6.0.1, 6.0.2, 6.1.0, 6.1.1, 6.2.0, 6.2.1, 6.2.2, 6.3.0, 6.3.1

 Download manual
Feedback submitted, thanks!