streamstats
Description
Adds cumulative summary statistics to all search results in a streaming manner. The streamstats command calculates statistics for each event at the time the event is seen. For example, you can calculate the running total for a particular field. The total is calculated by using the values in the specified field for every event that has been processed, up to the current event.
Syntax
streamstats [reset_on_change=<bool>] [reset_before="("<eval-expression>")"] [reset_after="("<eval-expression>")"] [current=<bool>] [window=<int>] [time_window=<span-length>] [global=<bool>] [allnum=<bool>] <stats-agg-term>... [<by clause>]
Required arguments
- stats-agg-term
- Syntax: <stats-func>( <evaled-field> | <wc-field> ) [AS <wc-field>]
- Description: A statistical aggregation function. See Stats function options. The function can be applied to an eval expression, or to a field or set of fields. Use the AS clause to place the result into a new field with a name that you specify. You can use wild card characters in field names. For more information on eval expressions, see Types of eval expressions in the Search Manual.
Optional arguments
- allnum
- Syntax: allnum=<boolean>
- Description: If true, computes numerical statistics on each field only if all of the values in that field are numerical.
- Default: false
- by clause
- Syntax: BY <field-list>
- Description: The name of one or more fields to group by.
- current
- Syntax: current=<boolean>
- Description: If true, the search includes the given, or current, event in the summary calculations. If false, the search uses the field value from the previous event.
- Default: true
- global
- Syntax: global=<boolean>
- Description: Used only when the
windowargument is set. Defines whether to use a single window,global=true, or to use separate windows based on theby clause. Ifglobal=falseandwindowis set to a non-zero value, a separate window is used for each group of values of the field specified in theby clause. - Default: true
- reset_after
- Syntax: reset_after="("<eval-expression>")"
- Description: After the streamstats calculations are produced for an event,
reset_afterspecifies that all of the accumulated statistics are reset if theeval-expressionreturnstrue. Theeval-expressionmust evaluate to true or false. Theeval-expressioncan reference fields that are returned by thestreamstatscommand. When thereset_afterargument is combined with thewindowargument, the window is also reset when the accumulated statistics are reset. - Default: false
- reset_before
- Syntax: reset_before="("<eval-expression>")"
- Description: Before the streamstats calculations are produced for an event,
reset_beforespecifies that all of the accumulated statistics are reset when theeval-expressionreturnstrue. Theeval-expressionmust evaluate to true or false. When thereset_beforeargument is combined with thewindowargument, the window is also reset when the accumulated statistics are reset. - Default: false
- reset_on_change
- Syntax: reset_on_change=<bool>
- Description: Specifies that all of the accumulated statistics are reset when the group by fields change. The reset is as if no previous events have been seen. Only events that have all of the group by fields can trigger a reset. Events that have only some of the group by fields are ignored. When the
reset_on_changeargument is combined with thewindowargument, the window is also reset when the accumulated statistics are reset. See the Usage section. - Default: false
- time_window
- Syntax: time_window=<span-length>
- Description: Specifies the window size for the
streamstatscalculations, based on time. Thetime_windowargument is limited by range of values in the_timefield in the events. To use thetime_windowargument, the events must be sorted in either ascending or descending time order. You can use thewindowargument with thetime_windowargument to specify the maximum number of events in a window. For the<span-length>, to specify five minutes, usetime_window=5m. To specify 2 days, usetime_window=2d. - Default: None. However, the value of the
max_stream_windowattribute in thelimits.conffile applies. The default value is 10000 events.
- window
- Syntax: window=<integer>
- Description: Specifies the number of events to use when computing the statistics.
- Default: 0, which means that all previous and current events are used.
Stats function options
- stats-func
- Syntax: The syntax depends on the function that you use. Refer to the table below.
- Description: Statistical and charting functions that you can use with the
streamstatscommand. Each time you invoke thestreamstatscommand, you can use one or more functions. However, you can only use oneBYclause. See Usage.
- The following table lists the supported functions by type of function. Use the links in the table to see descriptions and examples for each function. For an overview about using functions with commands, see Statistical and charting functions.
Type of function Supported functions and syntax Aggregate functions avg()
count()
distinct_count()
estdc()
estdc_error()
exactperc<int>()
max()
median()
min()
mode()
perc<int>()
range()
stdev()
stdevp()
sum()
sumsq()
upperperc<int>()
var()
varp()
Event order functions earliest()
first()
last()
latest()
Multivalue stats and chart functions list(X)
values(X)
Usage
The streamstats command is a centralized streaming command. See Command types.
The streamstats command is similar to the eventstats command except that it uses events before the current event to compute the aggregate statistics that are applied to each event. If you want to include the current event in the statistical calculations, use current=true, which is the default.
The streamstats command is also similar to the stats command in that streamstats calculates summary statistics on search results. Unlike stats, which works on the group of results as a whole, streamstats calculates statistics for each event at the time the event is seen.
Escaping string values
If your <eval-expression> contains a value instead of a field name, you must escape the quotation marks around the value.
The following example is a simple way to see this. Start by using the makeresults command to create 3 events. Use the streamstats command to produce a cumulative count of the events. Then use the eval command to create a simple test. If the value of the count field is equal to 2, display yes in the test field. Otherwise display no in the test field.
| makeresults count=3 | streamstats count | eval test=if(count==2,"yes","no")
The results appear something like this:
| _time | count | test |
|---|---|---|
| 2017-01-11 11:32:43 | 1 | no |
| 2017-01-11 11:32:43 | 2 | yes |
| 2017-01-11 11:32:43 | 3 | no |
Use the streamstats command to reset the count when the match is true. You must escape the quotation marks around the word yes. The following example shows the complete search.
| makeresults count=3 | streamstats count | eval test=if(count==2,"yes","no") | streamstats count as testCount reset_after="("match(test,\"yes\")")"
Here is another example.
You want to look for the value session is closed in the description field. Because the value is a string, you must enclose it in quotation marks. You then need to escape those quotation marks.
... | streamstats reset_after="("description==\"session is closed\"")"
The reset_on_change argument
You have a dataset with the field "shift" that contains either the value DAY or the value NIGHT. You run this search:
...| streamstats count BY shift reset_on_change=true
If the dataset is:
- shift
- DAY
- DAY
- NIGHT
- NIGHT
- NIGHT
- NIGHT
- DAY
- NIGHT
Running the command with reset_on_change=true produces the following streamstats results:
- shift, count
- DAY, 1
- DAY, 2
- NIGHT, 1
- NIGHT, 2
- NIGHT, 3
- NIGHT, 4
- DAY, 1
- NIGHT, 1
Basic examples
1. Calculate a snapshot of summary statistics
| This example uses the sample dataset from the Search Tutorial but should work with any format of Apache Web access log. If you want to try this example, download the data set from this topic in the Search Tutorial and follow the instructions to upload the data to your Splunk deployment. |
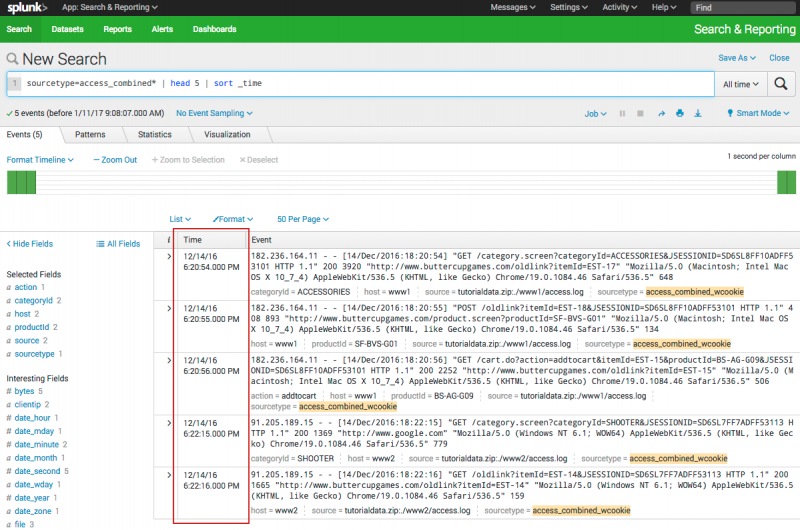
You want to determine the sum of the bytes used over a set period of time. The following search uses the first 5 events. Because search results typically display the most recent event first, the events are sorted in ascending order to see the oldest event first and the most recent event last. Ascending order enables the streamstats command to calculate statistics over time.
sourcetype=access_combined* | head 5 | sort _time
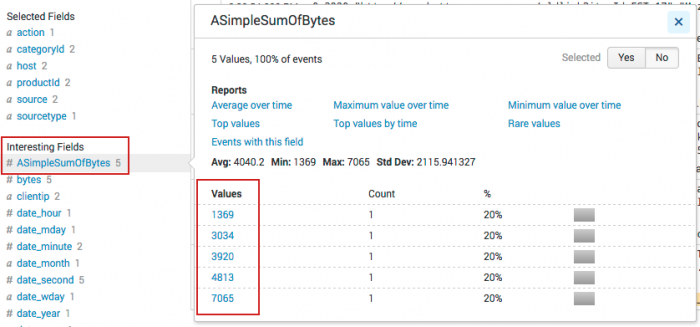
Add the streamstats command to generate a running total of the bytes over the 5 events. Then display the information in the calculated ASimpleSumOfBytes field. Organize the information by clientip.
sourcetype=access_combined* | head 5 |sort _time | streamstats sum(bytes) as ASimpleSumOfBytes by clientip
The following image shows the results of the search.
The streamstats command aggregates the statistics to the original data, which means that all of the original data is accessible for further calculations.
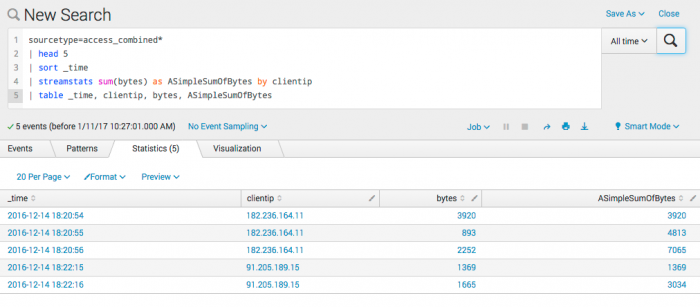
Add the table command to display the values in the _time, clientip, bytes, and ASimpleSumOfBytes fields.
sourcetype=access_combined* | head 5 |sort _time | streamstats sum(bytes) as ASimpleSumOfBytes by clientip | table _time, clientip, bytes, ASimpleSumOfBytes
The results are organized by clientip. Each event shows the timestamp for the event, the clientip, and the number of bytes used. The ASimpleSumOfBytes field shows a cumulative summary of the bytes for each clientip.
2. Compute the average of a field over the last 5 events
For each event, compute the average of field foo over the last 5 events, including the current event. Similar to doing trendline sma5(foo)
... | streamstats avg(foo) window=5
3. Compute the average of a field, with a by clause, over the last 5 events
For each event, compute the average value of foo for each value of bar including only 5 events, specified by the window size, with that value of bar.
... | streamstats avg(foo) by bar window=5 global=f
4. For each event, add a count of the number of events processed
This example adds to each event a count field that represents the number of events seen so far, including that event. For example, it adds 1 for the first event, 2 for the second event, and so on.
... | streamstats count
If you did not want to include the current event, you would specify:
... | streamstats count current=f
5. Apply a time-based window to streamstats
Assume that the max_stream_window argument in the limits.conf file is the default value of 10000 events.
The following search counts the events, using a time window of five minutes.
... | streamstats count time_window=5m
This search adds a count field to each event.
- If the events are in descending time order (most recent to oldest), the value in the count field represents the number of events in the next 5 minutes.
- If the events are in ascending time order (oldest to most recent), the count field represents the number of events in the previous 5 minutes.
If there are more events in the time-based window than the value for the max_stream_window argument, the max_stream_window argument takes precedence. The count will never be > 10000, even if there are actually more than 10,000 events in any 5 minute period.
Extended examples
6. Calculate the running total of distinct users over time
Each day you track unique users, and you would like to track the cumulative count of distinct users. This example calculates the running total of distinct users over time.
eventtype="download" | bin _time span=1d as day | stats values(clientip) as ips dc(clientip) by day | streamstats dc(ips) as "Cumulative total"
The bin command breaks the time into days. The stats command calculates the distinct users (clientip) and user count per day. The streamstats command finds the running distinct count of users.
This search returns a table that includes: day, ips, dc(clientip), and Cumulative total.
7. Calculate hourly cumulative totals for category values
This example uses streamstats to produce hourly cumulative totals for category values.
... | timechart span=1h sum(value) as total by category | streamstats global=f sum(total) as accu_total
The timechart command buckets the events into spans of 1 hour and counts the total values for each category. The timechart command also fills NULL values, so that there are no missing values. Then, the streamstats command is used to calculate the accumulated total.
8. Calculate when a DHCP IP lease address changed for a specific MAC address
This example uses streamstats to figure out when a DHCP IP lease address changed for a MAC address, 54:00:00:00:00:00.
source=dhcp MAC=54:00:00:00:00:00 | head 10 | streamstats current=f last(DHCP_IP) as new_dhcp_ip last(_time) as time_of_change by MAC
You can also clean up the presentation to display a table of the DHCP IP address changes and the times the occurred.
source=dhcp MAC=54:00:00:00:00:00 | head 10 | streamstats current=f last(DHCP_IP) as new_dhcp_ip last(_time) as time_of_change by MAC | where DHCP_IP!=new_dhcp_ip | convert ctime(time_of_change) as time_of_change | rename DHCP_IP as old_dhcp_ip | table time_of_change, MAC, old_dhcp_ip, new_dhcp_ip
For more details, refer to the Splunk Blogs post for this example.
See also
- Commands
- accum, autoregress, delta, fillnull, eventstats, trendline
Answers
Have questions? Visit Splunk Answers and see what questions and answers the Splunk community has using the streamstats command.
| strcat | table |
This documentation applies to the following versions of Splunk® Enterprise: 7.0.0, 7.0.1, 7.0.2, 7.0.3, 7.0.4, 7.0.5, 7.0.6, 7.0.7, 7.0.8, 7.0.9, 7.0.10, 7.0.11, 7.0.13


 Download manual
Feedback submitted, thanks!