About Pivot
The Splunk Pivot tool lets you quickly design reports with tables and data visualizations that present different aspects of a selected Data Model. Pivot lets you generate these reports with a UI interface instead of having to use the search processing language.
Accessing Pivot from the Datasets page
In Part 2, you built a data model and created a root dataset called Purchase Requests and added two child datasets, one for successful purchases and one for failed purchases.
- From the Buttercup Games dataset editor page, click Pivot.
- Select the Purchase Requests dataset. This is the dataset that you want use to create the pivot.
- The New Pivot page appears and shows information using the Purchase Requests dataset.
If your browser window is not full screen, the Apps bar is hidden. You can access the Apps bar by click the menu icon in the upper right corner of the window. The Apps bar slides down. Click the menu icon again to hide the Apps bar.
The New Pivot editor
The following image shows the New Pivot editor page. The key components of the editor page are highlighted.
The components of the New Pivot editor page that are identified in the image are described in the following table.
| Number | Element | Description |
|---|---|---|
| 1 | Visualization types | A list of icons that represent different visualization types. |
| 2 | Filters | You can specify time range and field filters for your pivot. |
| 3 | Pivot actions | Use the Pivot actions to:
|
| 4 | Job actions | Pivot job actions are similar to search job actions. You can pause or stop the progress of the pivot job, share or export the pivot job, and open the pivot in the Search app. |
| 5 | Apps bar | Navigate between the different views in the application you are in. For the Search & Reporting app the views are: Search, Datasets, Reports, Alerts, and Dashboards. |
Visualization types
The left-hand vertical bar contains icons that represent different visualization types. Selecting a different icon controls which Pivot builder and report interfaces display. Visualization types are: Statistics Table (default), Column Chart, Bar Chart, Scatter Chart, Bubble Chart, Area Chart, Line Chart, Pie Chart, Single Value Display, Radial Gauge, Marker Gauge, and Filler Gauge.
Pivot actions
The upper horizontal bar displays document-related actions. These actions include:
- Save as...: Save the current report as a new one (Report) or as a dashboard panel (Dashboard Panel).
- Clear: Reset the interface to its initial state, which will dismiss the saved report (if applicable), change the visualization type to Statistics Table, and populate the report with a single Column Value for the count of the dataset and a time filter for all time (if _time is an applicable field).
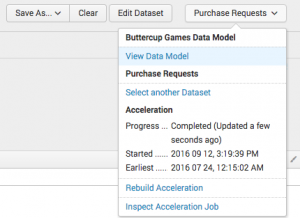
- Data model dataset: This is the right-most button. It takes its label from the data model dataset that was selected. For example, in the screenshot it is "Purchase Requests". Use this menu to navigate back to the list of data models (Select another Data Model), navigate back to the list of data model datasets (Select another Dataset), or edit the selected data model dataset (Edit Dataset). Additionally, you can rebuild acceleration and inspect the acceleration job.
Job actions
The Pause and Stop buttons control the progress of the Pivot job. Other actions include: Share, Export, Print, and Open in Search. Clicking Open in Search opens the Search view and runs the current search string.
Learn more
The topic briefly described what you need to know to access the pivot interface and build Pivots in the rest of this chapter. Read the Pivot Manual for more information.
Next steps
Continue to the next topic, where you will use Pivot to build a report from the Buttercup Games data models you created in a previous chapter.
| Define child datasets | Create and save a pivot report |
This documentation applies to the following versions of Splunk® Enterprise: 7.0.0, 7.0.1, 7.0.2, 7.0.3, 7.0.4, 7.0.5, 7.0.6, 7.0.7, 7.0.8, 7.0.9, 7.0.10, 7.0.11, 7.0.13


 Download manual
Feedback submitted, thanks!