Create and save a pivot report
This topic shows you how to use Pivot to create and save a simple report. This example uses the data model datasets that you created in Part 2 of this tutorial Create a new data model.
This is a very simple example. You will create more complex pivots later in this tutorial.
Create a new pivot
By default, the Pivot Editor interface displays elements to define a pivot table. There are four basic pivot element categories: Filters, Split Rows, Split Columns, and Column Values. When you first open the Pivot Editor for a specific dataset, only two elements are defined:
- A time range Filter element, which is set to All time by default.
- A Column Values element, which set to Count of <dataset_name>.
This gives you the single value, which is the total count of events returned by the dataset over all time. In this tutorial, this count is the "Count of Purchase Requests".
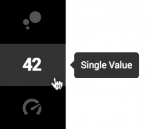
- Select the Single Value visualization type in the Visualization bar.
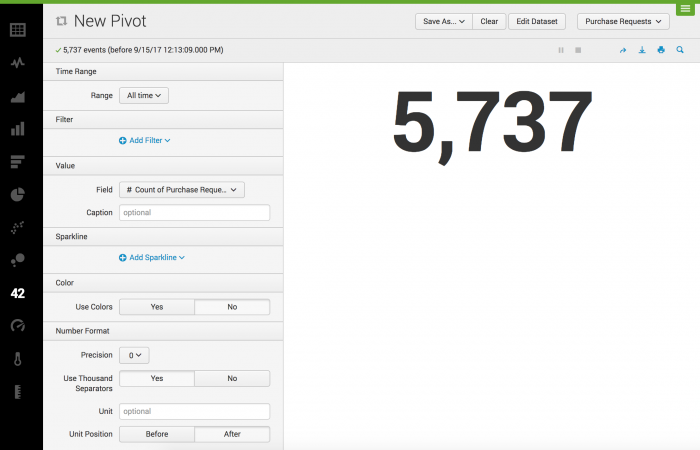
- The display changes to show you the options for the Single Value visualization.
- This visualization type includes options to specify:
- Time Range. By default, the time range is set to All time.
- Filter. You can specify fields to filter on.
- Value. Single value visualizations, which includes the three gauge visualization types, use the first column value element for their single value. In this dataset, the field is "Count of Purchase Requests".
- Sparkline. Displays a sparkline chart under the single value.
- Color. You can specify whether to use color and set the colors for specific ranges.
- Number Format. You can format the precision for the number and select whether or not to use a comma.
- Under the Value section, for Caption, type Purchase Requests.
- Under the Color section for Use Colors, click Yes.
Save the Pivot as a report
After you define a pivot, you can save it as either a report or a dashboard panel. In this tutorial, you save the single value display as a report. Dashboards and dashboard panels are discussed later in the tutorial.
- Click Save As and select Report.
- For Title, type
Total Purchase Requests. - Optional. For Description you can type a description for the report.
- For Time Range Picker, the Yes setting should already be selected.
- Click Save.
- After the report saves, a window indicating that your report has been created. You can change additional settings for the saved report, continue editing the current pivot, add the pivot to a dashboard, or view the report.
- Click View to view the report.
View saved reports
A report that is created from Pivot will always be saved under the current app and owner namespace.
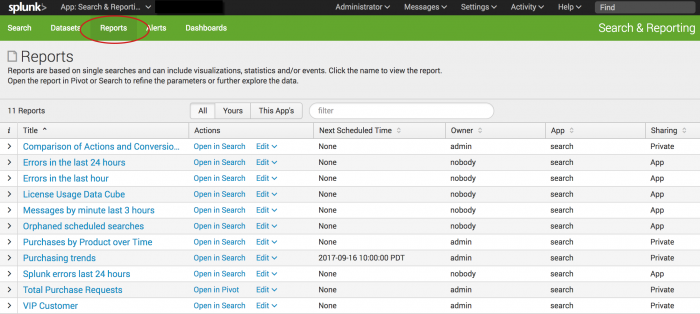
- Click Reports in the Apps bar to view the list of all saved reports.
- In the information column, click the greater than ( > ) symbol to view information about the Total Purchase Requests report.
- Click the name of the report, Total Purchase Requests, to view the report.
Next steps
In this topic, you created and saved a report using Pivot. Continue to the next topic to create more pivot visualizations.
| About Pivot | Create a pivot table |
This documentation applies to the following versions of Splunk® Enterprise: 7.0.0, 7.0.1, 7.0.2, 7.0.3, 7.0.4, 7.0.5, 7.0.6, 7.0.7, 7.0.8, 7.0.9, 7.0.10, 7.0.11, 7.0.13


 Download manual
Feedback submitted, thanks!