Search: Scheduler Activity
This topic is a reference for the Scheduler Activity dashboards in the Monitoring Console. See About the Monitoring Console.
What do these dashboards show?
The Scheduler activity: Deployment dashboard shows an overview of the search or report scheduler. The instance dashboard shows more detailed information about the scheduler on a particular instance.
These dashboards show activity and success rate of the scheduler. That is, of all the searches that attempted to run, how many succeeded? A scheduled search can fail because of concurrency problems or because of a search workload.
The panels in these dashboards qualify the type of failure. Skip ratio and execution latency quantify the scheduler's performance.
The scheduler activity dashboards are useful whether or not you are using search head clustering. If you have a search head cluster, you can also use the Search head clustering: Scheduler delegation dashboard, which deals with how the captain orchestrates scheduler jobs.
Interpret results in these dashboards
In the deployment dashboard, the Statistics panel describes how the scheduler is performing per instance, but including all instances in the deployment. For example, maximum is the maximum on any individual instance in the deployment.
What to look for in these dashboards
If your scheduler reaches the maximum allowed concurrent searches, you will run into problems scheduling additional or long-running searches. See Configure the priority of scheduled reports for more information.
The snapshot quantities skip ratio and average execution latency should both be low.
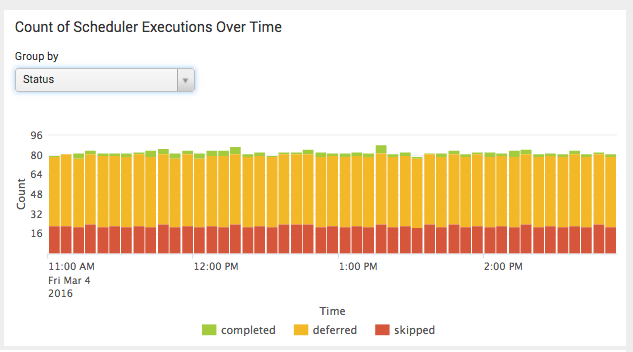
The following is an example Scheduler activity: Instance panel for a scheduler that is skipping reports.
To find why the scheduler is skipping reports, scroll down to the panel labeled Count of skipped reports by name and reason.
Troubleshoot these dashboards
The scheduler activity dashboards require the monitored instances to be running Splunk Enterprise 6.3.0 or later.
Make sure you have completed all of the Monitoring Console setup steps.
| Search: KV Store | Search: Distributed Search |
This documentation applies to the following versions of Splunk® Enterprise: 7.0.0, 7.0.1, 7.0.2, 7.0.3, 7.0.4, 7.0.5, 7.0.6, 7.0.7, 7.0.8, 7.0.9, 7.0.10, 7.0.11, 7.0.13, 7.1.0, 7.1.1, 7.1.2, 7.1.3, 7.1.4, 7.1.5, 7.1.6, 7.1.7, 7.1.8, 7.1.9, 7.1.10, 7.2.0, 7.2.1, 7.2.2, 7.2.3, 7.2.4, 7.2.5, 7.2.6, 7.2.7, 7.2.8, 7.2.9, 7.2.10, 7.3.0, 7.3.1, 7.3.2, 7.3.3, 7.3.4, 7.3.5, 7.3.6, 7.3.7, 7.3.8, 7.3.9, 8.0.0, 8.0.1, 8.0.2, 8.0.3, 8.0.4, 8.0.5, 8.0.6, 8.0.7, 8.0.8, 8.0.9, 8.0.10, 8.1.0, 8.1.1, 8.1.2, 8.1.3, 8.1.4, 8.1.5, 8.1.6, 8.1.7, 8.1.8, 8.1.9, 8.1.10, 8.1.11, 8.1.12, 8.1.13, 8.1.14, 8.2.0, 8.2.1, 8.2.2, 8.2.3, 8.2.4, 8.2.5, 8.2.6, 8.2.7, 8.2.8, 8.2.9, 8.2.10, 8.2.11, 8.2.12, 9.0.0, 9.0.1, 9.0.2, 9.0.3, 9.0.4, 9.0.5, 9.0.6, 9.0.7, 9.0.8, 9.0.9, 9.0.10, 9.1.0, 9.1.1, 9.1.2, 9.1.3, 9.1.4, 9.1.5, 9.1.6, 9.1.7, 9.1.8, 9.1.9, 9.2.0, 9.2.1, 9.2.2, 9.2.3, 9.2.4, 9.2.5, 9.2.6, 9.3.0, 9.3.1, 9.3.2, 9.3.3, 9.3.4, 9.4.0, 9.4.1, 9.4.2

 Download manual
Feedback submitted, thanks!