Use the monitoring console to determine your topology
If your outgoing admin left you information about a monitoring console (formerly called a distributed management console, DMC), you can use this to discover your deployment's topology.
Prerequisites
Read Deployment topologies. This topic describes the elements of Splunk Enterprise deployments and offers essential guidance on how to discover your deployment topology.
Access the monitoring console
Refer to any information provided by your previous administrator or by your organization.
The monitoring console can be hosted on its own instance, or it can be colocated with a cluster master. Less commonly, it can be colocated with another management component. See Which instance should host the console? in Monitoring Splunk Enterprise.
Log into Splunk Web on a node that is likely to be the monitoring console. If you do not know what node is your monitoring console, try a cluster master. If that does not give you results, try any search head.
When you have found the node that runs the monitoring console, navigate to the monitoring console:
- Click Settings from anywhere in Splunk Web
- Click the Monitoring Console icon on the left of the panel to open the monitoring console.
Monitoring console overview
The home page of the monitoring console is the Overview page.
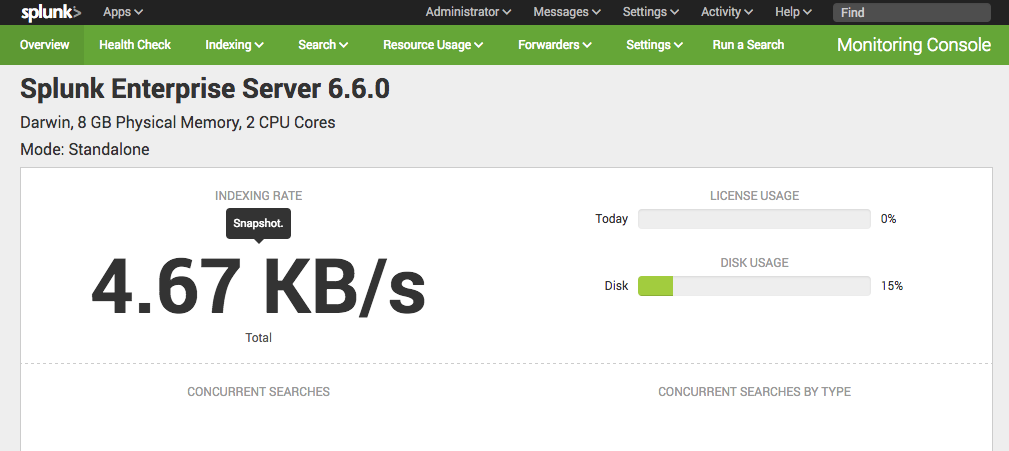
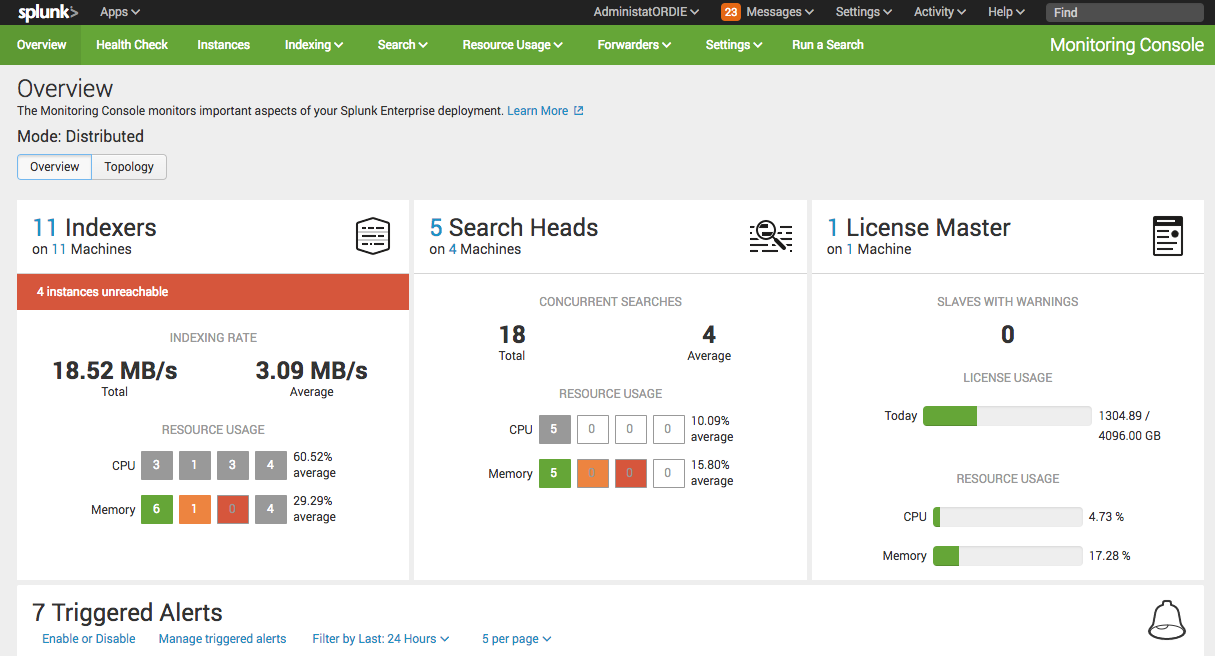
The monitoring console has two modes, standalone and distributed. On the basis of the following screen shots, determine whether the monitoring console on your instance is configured in standalone or distributed mode.
The overview in standalone mode:

The overview in distributed mode:

If you do not have the monitoring console configured in distributed mode on any instance in your deployment, do not set it up at this point. Instead, continue to Examine configuration files to determine your topology.
Discover components and topology from the monitoring console
From the Overview page, click the Topology toggle to learn about your deployment's topology.
- See the instances in your deployment.
- Click each instance to view details including its Splunk Enterprise version.
- Record this information on your deployment diagram.
See all of the components colocated on an instance:
- Click Instances.
- Use the Group dropdown to view each component in your deployment, leaving KV store for the last.
- For each instance, note the information displayed in the table. The information under "Role" is the component.
- Record this information on your deployment diagram.
An admin can optionally set up forwarder monitoring in the monitoring console, as of Splunk Enterprise 6.3.0. To view forwarder information:
- Click Forwarders > Forwarder deployment.
- Use the Split by dropdown to understand your set of forwarders.
- Scroll down to the Status and Configuration panel.
- Record information about forwarder type, Splunk version, OS, and system architecture on your diagram.
Do not yet enable forwarder monitoring.
You can optionally rebuild the forwarder asset table. If a forwarder is decommissioned, it remains on the forwarder dashboards until you rebuild the forwarder asset table. This step is probably not immediately necessary, but if you find that your forwarder dashboards contain null results from several forwarders, you might want to rebuild the asset table. If you have many forwarders, it can take a while to run.
- In the monitoring console, click Settings > Forwarder Monitoring Setup.
- Click Rebuild forwarder assets.
- Select a time range or leave the default of 24 hours.
- Click Start Rebuild.
You will survey groups of forwarders called server classes later, in Review your apps and add-ons.
Validate your monitoring console setup
If you have used the monitoring console to populate your diagram, it is almost complete.
To ensure accuracy, validate that the monitoring console was correctly configured by your previous administrator. Use the configuration file methods that follow. To validate the monitoring console setup:
- Test one or two of the instances with multiple server roles, also known as components.
- Verify that the server roles displayed for that instance on the monitoring console Instances page matches the information you gather using the configuration file method.
- If it does not, investigate configuration files of other instances and populate your deployment diagram with that information.
- After you complete the rest of the orientation tasks in this manual and reach Monitor system health, correct the monitoring console setup.
| Deployment topologies | Examine configuration files to determine your topology |
This documentation applies to the following versions of Splunk® Enterprise: 7.0.0, 7.0.1, 7.0.2, 7.0.3, 7.0.4, 7.0.5, 7.0.6, 7.0.7, 7.0.8, 7.0.9, 7.0.10, 7.0.11, 7.0.13, 7.1.0, 7.1.1, 7.1.2, 7.1.3, 7.1.4, 7.1.5, 7.1.6, 7.1.7, 7.1.8, 7.1.9, 7.1.10, 7.2.0, 7.2.1, 7.2.2, 7.2.3, 7.2.4, 7.2.5, 7.2.6, 7.2.7, 7.2.8, 7.2.9, 7.2.10, 7.3.0, 7.3.1, 7.3.2, 7.3.3, 7.3.4, 7.3.5, 7.3.6, 7.3.7, 7.3.8, 7.3.9
 Download manual
Feedback submitted, thanks!