Use trellis layout to split visualizations
Trellis layout lets you split search results by fields or aggregations and visualize each field value separately.
This is a single value visualization with trellis layout applied. It splits customer purchase results by product category values. Users can see how the purchase metric varies for different product types.

Use cases
Use trellis layout to make value differences in a given data dimension more visible.
Highlight outlying values
Trellis layout can help to make outlying field values more noticeable.
For example, your dashboard users might want to track status across multiple servers in a network. A single value visualization with trellis layout can show the status of multiple servers at once. Servers with unusual status values stand out.
Compare trends for a specific metric
You can split search results so that it is easier to compare different field values visually.
For example, you can apply trellis layout to a bar chart showing recent customer activity for different product types. Splitting on the customer action field lets you scan variations in purchase frequency across different product types.
Monitor multiple resources with one search
Trellis layout can be helpful if you want to monitor multiple resources without creating and running multiple searches or generating multiple visualizations. You can use one search to generate metrics for each resource in a category or group and then split the visualization on the field that you are tracking.
Data formatting for trellis layout
You can use trellis layout to split your search results on a field. You can also split results on an aggregation if your search includes two or more aggregations, such as a count or sum.
Before you enable trellis layout, consider the comparisons or trends that you want to provide at a glance. Make sure that your search results include the fields or aggregations that represent these values.
When you're using a trellis layout, make sure that the last line of your search is a transforming command like stats, chart, or timechart. If the last line of your search does not contain a transforming command, your trellis layout might display an incorrect visualization.
Generating split fields
To use trellis layout, make sure that your search results include the field that you want to use for splitting the visualization. The split field is additional to any fields that you might need to generate the visualization without trellis layout. For example, you can generate a single value visualization using the following search.
index=_internal | stats count
To use trellis layout, adjust the search to generate an additional field for splitting the visualization.
index=_internal | stats count by sourcetype
You can split the single value on the sourcetype field to show a count for each sourcetype in your search results.
Use additional fields to add insight
Depending on your use case, you can generate multiple result fields to add further data dimensions to each visualization segment.
As an example, you can aggregate recent retail website data by customer action and product type. With these fields in your search results, you can use one of them to split the visualization. Users can use the split visualizations to compare customer actions across product types or see how product types relate to customer actions.
For more information on creating searches, see Statistical and charting functions in the Search Reference.
You can access the trellis layout menu when creating a visualization or editing a visualization in a dashboard.
Trellis layout is not available for table visualizations or cluster maps.
If you are building a visualization on the Search page, you can access the Trellis configuration menu on the Visualization tab.

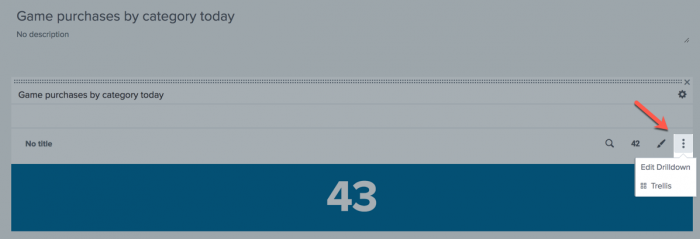
- From a dashboard, click Edit to open the dashboard editor.
- Find the panel where you want to apply trellis layout.
- Click the "More actions" icon and select Trellis.

Configure trellis layout
The trellis layout menu lets you select "Split by" result fields or aggregations and configure segments.
Select a split field or aggregation
When you split the visualization by a field or aggregation, a separate visualization segment appears for each value in the selected field.
Result fields generated with the eval command appear in the aggregations list.
If you do not see the split field or aggregation that you want to use in this list, adjust the search to make sure that it generates the field in your search results. You might need to adjust your search to return additional fields that are not necessary for generating the visualization without trellis layout.
Adjust segment size
Select one of the segment size options. Segment size affects panel data density. Panels can show more small sized segments at once. Larger segments can help users make more detailed visual comparisons depending on the number of segments.
Small segments

Large segments

Configure scale sharing
The trellis layout menu includes a scale sharing option for the following visualization types.
- Line and area charts
- Bar and column charts
- Choropleth map
Select "Shared" to use the same axis or legend value ranges in all segments. Select "Independent" to use axis or legend value ranges scaled for the values in each segment.
Segment formatting and appearance
Use the Format menu or Simple XML to configure visualization segment appearance. Format a visualization with trellis layout in the same way that you format a visualization without trellis layout. Each segment gets the format configurations that you apply.
Choropleth map scroll and zoom
In Choropleth maps with trellis layout, you might need to scroll and zoom a segment to focus it on a specific location. Limit scrolling and zooming to one segment to avoid triggering display changes in other segments. After focusing this segment, open the Format menu and click "Populate with current map settings" to update the focus in all segments.
Trellis layout and dashboard display
Segment density
The number of segments that trellis layout generates varies according to the number of split field or aggregation values in your search results. Dashboard panels might include a scroll bar if there are too many visualization segments to show at once.

Use the Trellis menu to adjust the segment size and show more segments in the panel. You can also use the dashboard editor to drag the panel size or change the panel height option in Simple XML.
To change the order in which segments appear, adjust the search to sort or change search result order.
Panel and row best practice
Separate panels using trellis layout into their own dashboard rows. Displaying additional content in the same row can constrain trellis layout content and make the dashboard difficult to scan.
| Avoid | Best practice |
|---|---|
| Additional panels in the same row constrain display.
|
Put the panel with trellis layout in its own row.
|


Drilldown in trellis layout
Use the drilldown editor or Simple XML to enable and configure drilldown. After you apply Trellis layout to a visualization, drilldown is available in each visualization segment.
Drilldown options
Typical drilldown actions, such as linking to a search or an external URL, are available for visualizations using Trellis layout. Depending on the behavior that you want, you can configure drilldown to capture and use details from the element and the visualization segment that a user clicks.
Example
This drilldown links to a search. By default, the secondary search modifies the original search to include field values from the clicked segment.
For example, trellis layout splits a retail activity visualization by customer action. if a user clicks the "ARCADE" category column in the "purchase" customer action segment, a secondary search using these field values opens.
Clicked visualization segment and column

Search generating the visualization
...| stats count by action, categoryId | rename categoryId as "category"
Drilldown search
...| action=purchase | rename categoryId as "category" | search category=ARCADE
Predefined tokens for trellis split fields
If your trellis layout splits on a search result field, you can use the trellis.name and trellis.value predefined tokens to access the split field name and value from a clicked visualization segment.
You can pass these values to a drilldown target, such as a form or external URL. This example drilldown links to an external retail website, using the trellis.value token to pass in the product field value from the clicked segment.
<drilldown>
<link>
  http://buttercupgames.com?product=$trellis.value$
</link>
</drilldown>
Aggregations are not available in predefined tokens.
Limitations
- Fields generated with the
evalcommand appear as aggregations in the trellis layout configuration menu. - Trellis layout is not available for table visualizations or cluster maps.
- A predefined token is not available for aggregations used for splitting a visualization.
- Visualizations using trellis layout do not render in dashboard PDFs.
- The maximum limit for the displayed series is 20. After the number of series exceeds 20, pagination begins.
Configure trellis layout in Simple XML
Use the following Simple XML options to configure trellis layout.
| Option name | Type | Default | Description |
|---|---|---|---|
trellis.enabled
|
Boolean | 0
|
Enable or disable trellis layout. Defaults to 0 (disabled).
|
trellis.scales.shared
|
Boolean | 1
|
Indicate whether to to share scale for axes in line, area, column, and bar charts or value ranges in Choropleth map segments. Use one of the following values.
|
trellis.size
|
String | medium
|
Configure the visualization segment size. Segment size affects panel display density for the split visualization. Use one of the following values.
|
trellis.splitBy
|
Result field name | N/A | Indicate the search result field or aggregation name to use for splitting the visualization. Segments appear for each value in this field. |
Example
Research sales trends
An analyst for an online retailer researches customer actions by product category. They use the following search to find recent customer action events by product category.
source=recent_sales_data action != NULL
| rename categoryId as "category"
|  chart count by category, action
The search generates the following column chart, showing customer actions across all product categories.

The analyst can use trellis layout to split the visualization into separate column charts for each customer action category. Trellis layout lets the analyst compare trends in the product types associated with each action.

| (Optional) Use Trellis view to visualize multiple aggregate functions | Dashboard overview |
This documentation applies to the following versions of Splunk® Enterprise: 7.1.0, 7.1.1, 7.1.2, 7.1.3, 7.1.4, 7.1.5, 7.1.6, 7.1.7, 7.1.8, 7.1.9, 7.1.10, 7.2.0, 7.2.1, 7.2.2, 7.2.3, 7.2.4, 7.2.5, 7.2.6, 7.2.7, 7.2.8, 7.2.9, 7.2.10, 7.3.0, 7.3.1, 7.3.2, 7.3.3, 7.3.4, 7.3.5, 7.3.6, 7.3.7, 7.3.8, 7.3.9, 8.0.0, 8.0.1, 8.0.2, 8.0.3, 8.0.4, 8.0.5, 8.0.6, 8.0.7, 8.0.8, 8.0.9, 8.0.10, 8.1.0, 8.1.1, 8.1.2, 8.1.3, 8.1.4, 8.1.5, 8.1.6, 8.1.7, 8.1.8, 8.1.9, 8.1.10, 8.1.11, 8.1.12, 8.1.13, 8.1.14, 8.2.0, 8.2.1, 8.2.2, 8.2.3, 8.2.4, 8.2.5, 8.2.6, 8.2.7, 8.2.8, 8.2.9, 8.2.10, 8.2.11, 8.2.12, 9.0.0, 9.0.1, 9.0.2, 9.0.3, 9.0.4, 9.0.5, 9.0.6, 9.0.7, 9.0.8, 9.0.9, 9.0.10, 9.1.0, 9.1.1, 9.1.2, 9.1.3, 9.1.4, 9.1.5, 9.1.6, 9.1.7, 9.1.8, 9.1.9, 9.2.0, 9.2.1, 9.2.2, 9.2.3, 9.2.4, 9.2.5, 9.2.6, 9.3.0, 9.3.1, 9.3.2, 9.3.3, 9.3.4, 9.4.0, 9.4.1, 9.4.2
Feedback submitted, thanks!