Use time to find nearby events
The Splunk Web timeline and time ranges for search are based on event timestamps.
While searching for errors or troubleshooting an issue, looking at events that happened around the same time can help correlate results and find the root cause. This topic discusses how you can search for surrounding events using an event's timestamp and using the timeline.
Use time accelerators
The _time field represents the timestamp of an event. When you run a search to retrieve events, the timestamp for each event is listed under the Time column.
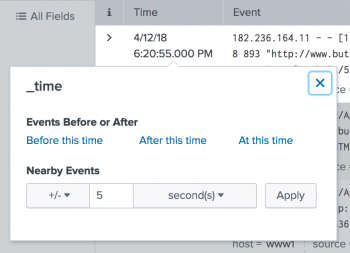
You can click the timestamp of an event and open a dialog box containing controls, called a _time accelerator. Use the _time accelerator to run a new search that retrieves events chronologically close to that event.
You can search for all events that occurred before or after the event time. The accelerators are Before this time, After this time, and At this time. In addition, you can search for nearby events. For example, you can search for + 30 seconds, - 1 minutes, +/- 5 hours, and so on.
Use the timeline
The timeline is a histogram of the number of events returned by a Splunk search over a chosen time range. The time range is broken up into smaller time intervals (such as seconds, minutes, hours, or days), and the count of events for each interval is displayed as a column.
The location of each column on the timeline corresponds to an instance when the events that match your search occurred. If there are no columns at a time period, no events were found then. The taller the column, the more events occurred at that time.
Spikes in the number of events or no events along the timeline can indicate time periods that you want to investigate.
The timeline has drilldown functionality similar to the table and chart drilldown. When you click on a column in the timeline, your search results update to show only the events represented by the column. If you double-click on a column, you re-run the search over the time range represented by the column. Then, you can search for all surrounding events at this time range.
| Specify time ranges for real-time searches | How time zones are processed by the Splunk platform |
This documentation applies to the following versions of Splunk® Enterprise: 7.1.0, 7.1.1, 7.1.2, 7.1.3, 7.1.4, 7.1.5, 7.1.6, 7.1.7, 7.1.8, 7.1.9, 7.1.10, 7.2.0, 7.2.1, 7.2.2, 7.2.3, 7.2.4, 7.2.5, 7.2.6, 7.2.7, 7.2.8, 7.2.9, 7.2.10, 7.3.0, 7.3.1, 7.3.2, 7.3.3, 7.3.4, 7.3.5, 7.3.6, 7.3.7, 7.3.8, 7.3.9, 8.0.0, 8.0.1, 8.0.2, 8.0.3, 8.0.4, 8.0.5, 8.0.6, 8.0.7, 8.0.8, 8.0.9, 8.0.10, 8.1.0, 8.1.1, 8.1.2, 8.1.3, 8.1.4, 8.1.5, 8.1.6, 8.1.7, 8.1.8, 8.1.9, 8.1.10, 8.1.11, 8.1.12, 8.1.13, 8.1.14, 8.2.0, 8.2.1, 8.2.2, 8.2.3, 8.2.4, 8.2.5, 8.2.6, 8.2.7, 8.2.8, 8.2.9, 8.2.10, 8.2.11, 8.2.12, 9.0.0, 9.0.1, 9.0.2, 9.0.3, 9.0.4, 9.0.5, 9.0.6, 9.0.7, 9.0.8, 9.0.9, 9.0.10, 9.1.0, 9.1.1, 9.1.2, 9.1.3, 9.1.4, 9.1.5, 9.1.6, 9.1.7, 9.1.8, 9.1.9, 9.2.0, 9.2.1, 9.2.2, 9.2.3, 9.2.4, 9.2.5, 9.2.6, 9.3.0, 9.3.1, 9.3.2, 9.3.3, 9.3.4, 9.4.0, 9.4.1, 9.4.2

 Download manual
Feedback submitted, thanks!