Examine configuration files to determine your topology
In this method of discovery, you examine certain configuration files residing on each Splunk Enterprise instance. The files contain settings whose presence or absence help you to determine what component the instance functions as. The settings also help determine the relationships between components, and thus, the overall topology.
The discovery process looks for the characteristic configurations of each component type.
It can be helpful to draw a diagram of your deployment, as you go about the discovery process. See Draw a diagram of your deployment.
Prerequisites
Read the following material:
- The chapter Administer Splunk Enterprise with configuration files in the Admin Manual. The topics in this chapter provide important background information on configuration files: what they are, where they reside, and how they layer on top of one another.
- Deployment topologies. This topic describes the elements of Splunk Enterprise deployments and offers essential guidance on how to discover your deployment topology.
Configuration file locations
Copies of configuration files can reside in several locations, including system directories and app directories. If a configuration file has copies in multiple locations, the operative value of each setting in the file is determined by a process of file layering, based on an order of precedence.
For details on configuration file locations, see Configuration file directories in the Admin Manual. To learn how multiple copies of a configuration file layer, see Configuration file precedence in the Admin Manual.
The files that contain component configurations, such as server.conf, usually reside only under $SPLUNK_HOME/etc/system/local, because component settings are system-level configurations and should not be app-dependent. To be certain of your configurations, however, you must examine all possible locations for copies of each relevant file.
How to examine configuration files
To examine a configuration file, you can use either a text editor or the btool utility.
Caution: If you use a text editor, do not make any changes to the files.
The btool utility in $SPLUNK_HOME/bin provides a quick way to sift through all copies of a configuration file. The advantage of btool is that it reports back the final set of configurations that results after layering all copies of the file. For syntax and other details, see Use btool to troubleshoot configurations in the Troubleshooting Manual.
Discover processing components
First, examine each instance to see if it hosts a processing component. Later, you examine the instances to see if they host management components.
To discover the processing components, follow these two procedures:
- Identify search heads and indexers.
- Identify forwarders.
An instance typically contains at most one processing component. Therefore, for each instance, follow each procedure, in order, until you identify what processing component, if any, the instance contains.
Processing components in the procedures are identified by bold text.
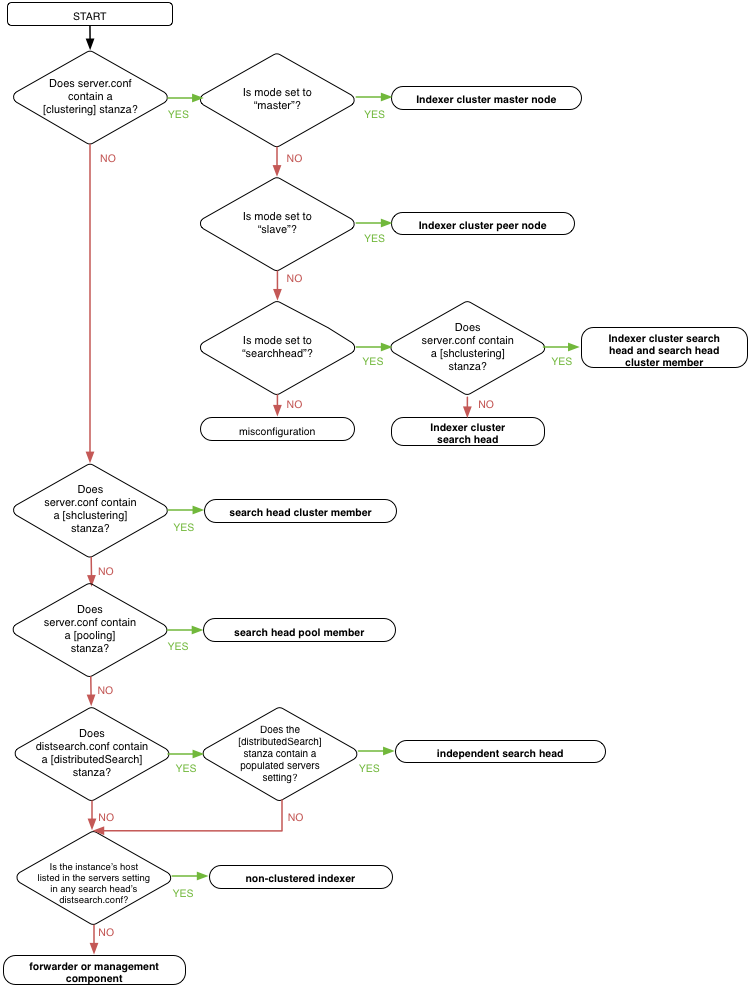
Identify search heads and indexers
Determine whether the instance is a search head or an indexer and, if so, what type of search head or indexer.
-
Examine
server.confin$SPLUNK_HOME/etc/system/local.-
Look for a
[clustering]stanza. If found, this instance is a node of an indexer cluster.
To determine the indexer cluster node type, examine themodesetting:-
If
mode = master, this instance is an indexer cluster master node. Stop here.
Note: The master node is a management component, not a processing component. Because it is configured inserver.conf, however, it makes sense to look for it while examiningserver.conffor processing components. -
If
mode = slave, this instance is an indexer cluster peer node, also known as a clustered indexer. Stop here. -
If
mode = searchhead, this instance is an indexer cluster search head node. Continue to the next step, to determine whether this indexer cluster search head is also a member of a search head cluster.
-
If
-
Look for a
[shclustering]stanza. If found, this instance is a search head cluster member. Stop here.
Note: Depending on the deployment topology, a search head cluster member can also be a search head node in an indexer cluster. -
Look for a
[pooling]stanza. If found, this instance is a a search head pool member. Stop here.
-
Look for a
-
Examine
distsearch.confin$SPLUNK_HOME/etc/system/local.-
Look for a populated
serverssetting in the[distributedSearch]stanza. If found, this instance is an independent search head. Stop here.
Note: Search heads that are members of search head clusters or search head pools also have a populatedserverssetting. However, you have already identified such search heads in earlier steps of this procedure, so any search heads with a populatedserverssetting that remain to be identified at this point of the procedure must be independent search heads.
-
Look for a populated
-
On all instances previously identified as either search head cluster members, search head pool members, or independent search heads, examine the
serverssetting indistsearch.conf.
The list of addresses inserversspecifies the hosts for the indexers that this search head connects to. Use this list to determine which instances in your deployment are independent (non-clustered) indexers. Stop here.
Note: In an indexer cluster, search heads do not use theserverslist to specify their indexers. Therefore, if an indexer appears in this list, it is a non-clustered indexer.
Once you have identified your search heads and indexers, any remaining instances are either forwarders or management components.
The following flowchart encapsulates the procedure above:
Caution: In complex deployments, a search head might manage searches for multiple indexer clusters, or for both an indexer cluster and a set of independent indexers. If you suspect that you have such a deployment topology, you can investigate the search head's configuration more deeply. See Search across multiple indexer clusters and Search across both clustered and non-clustered search peers in Managing Indexers and Clusters of Indexers.
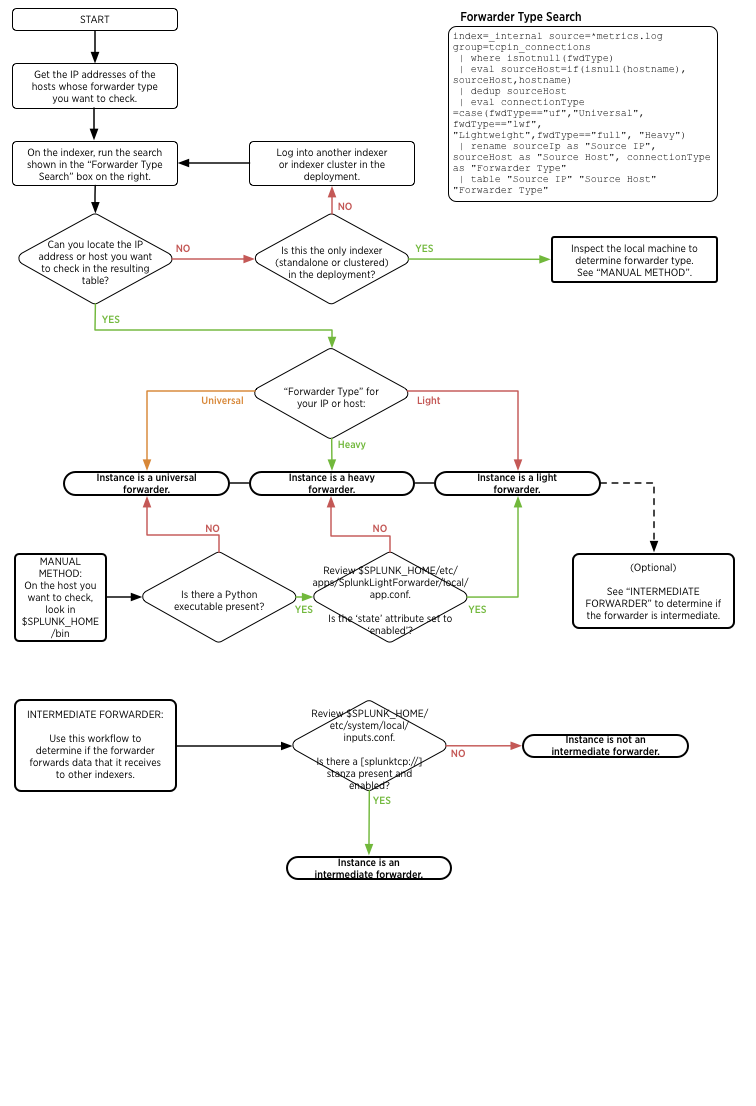
Identify forwarders
If the instance is not an indexer or a search head, it might be a forwarder.
The indexers in a Splunk deployment provide information on the forwarders that have been installed in that deployment. Indexers in a deployment keep logs of each forwarder connection and type.
Use Splunk search to identify forwarders
You can get a list of every forwarder that has connected to a Splunk indexer or indexer cluster by logging into Splunk Enterprise on an indexer or search head and running the following search in Splunk Web:
index=_internal source=*metrics.log group=tcpin_connections
 | where isnotnull(fwdType)
 | eval sourceHost=if(isnull(hostname), sourceHost,hostname)
 | dedup sourceHost
 | eval connectionType =case(fwdType=="uf","Universal", fwdType=="lwf", "Lightweight",
   fwdType=="full","Heavy")
 | rename sourceIp as "Source IP", sourceHost as "Source Host",
   connectionType as "Forwarder Type"
 | table "Source IP" "Source Host" "Forwarder Type"
If you have the IP address or host name of a machine whose forwarder status and type you want to check, you can modify the search to specify the host name or IP address:
index=_internal source=*metrics.log group=tcpin_connections
   [sourceIp=<ip address>|hostname=<host name>]
 | where isnotnull(fwdType)
 | eval sourceHost=if(isnull(hostname), sourceHost,hostname)
 | dedup sourceHost
 | eval connectionType =case(fwdType=="uf","Universal", fwdType=="lwf", "Lightweight",
   fwdType=="full", "Heavy")
 | rename sourceIp as "Source IP", sourceHost as "Source Host",
   connectionType as "Forwarder Type"
 | table "Source IP" "Source Host" "Forwarder Type"
If the table that these searches generate does not list information on the machine you want information about, or you do not have access to Splunk Web, you can examine the machine itself to determine the forwarder type.
Manually identify forwarders
- On the machine whose status you want to check, look in the
$SPLUNK_HOME/bindirectory. Check to see if apythonexecutable (python.exeon Windows) is present in this directory.- If there is not, then this instance is a universal forwarder. You can stop here or proceed to Identify intermediate forwarders in the next section.
- If there is, then review
$SPLUNK_HOME/etc/apps/SplunkLightForwarder/local/app.confto see if thestatesetting in that file is set toenabled.- If it is, then the instance is a light forwarder. Proceed to Identify intermediate forwarders in the next section in either case.
- If it is not, then the instance is a heavy forwarder. Proceed to Identify intermediate forwarders in the next section in either case.
Identify intermediate forwarders
Intermediate forwarders receive data from other forwarders to send to indexers. Any forwarder can be an intermediate forwarder.
- Review
$SPLUNK_HOME/etc/system/local/inputs.confon the forwarder. Is there asplunktcp://stanza present and enabled?- If there is, then the instance is an intermediate forwarder.
- If there is not, then the instance is not an intermediate forwarder.
See the following flowchart to understand how forwarder discovery works:

From processing components to management components
Once you reach this point for all your Splunk Enterprise instances, you know all your processing components, as well as the cluster master management component, if any.
If you cannot find any processing component on a particular instance, the instance hosts management components only.
In the next section, determine which instances host management components.
Discover management components
Management components can be located on their own dedicated Splunk Enterprise instance, co-located with a processing component, or co-located with other management components. Therefore, any of your Splunk Enterprise instances could contain management components.
Universal forwarder instances, however, cannot also contain management components.
Also, there is usually at most one of each management component for an entire deployment So, for example, once you identify the instance that hosts the deployment server, if any, you can stop looking for other deployment server instances.
This table shows, for each management component, its key indicator, along with the configuration file that pertains to the indicator, if any.
| Component type | Configuration file | Key indicator |
|---|---|---|
| Monitoring console | $SPLUNK_HOME/etc/apps/splunk_monitoring_console
|
the existence of splunk_management_console_assets.conf
|
| Deployment server | $SPLUNK_HOME/etc/system/local/serverclass.conf
|
[serverClass:<name>] stanzas
|
| License master | $SPLUNK_HOME/etc/system/local/server.conf
|
[license] stanza with master_uri = self
|
| Indexer cluster master | $SPLUNK_HOME/etc/system/local/server.conf
|
[cluster] stanza with mode = master
|
| Search head cluster deployer | N/A | populated $SPLUNK_HOME/etc/shcluster/ directory
|
If you have completed all the steps in this topic, you should now understand the specifics of your Splunk Enterprise topology. You should know the location and function of each instance and the relationships between instances.
| Use the monitoring console to determine your topology | Components and their relationship with the network |
This documentation applies to the following versions of Splunk® Enterprise: 7.0.0, 7.0.1, 7.0.2, 7.0.3, 7.0.4, 7.0.5, 7.0.6, 7.0.7, 7.0.8, 7.0.9, 7.0.10, 7.0.11, 7.0.13, 7.1.0, 7.1.1, 7.1.2, 7.1.3, 7.1.4, 7.1.5, 7.1.6, 7.1.7, 7.1.8, 7.1.9, 7.1.10, 7.2.0, 7.2.1, 7.2.2, 7.2.3, 7.2.4, 7.2.5, 7.2.6, 7.2.7, 7.2.8, 7.2.9, 7.2.10, 7.3.0, 7.3.1, 7.3.2, 7.3.3, 7.3.4, 7.3.5, 7.3.6, 7.3.7, 7.3.8, 7.3.9, 8.0.0, 8.0.1, 8.0.2, 8.0.3, 8.0.4, 8.0.5, 8.0.6, 8.0.7, 8.0.8, 8.0.9, 8.0.10

 Download manual
Feedback submitted, thanks!