Monitor workload management
The monitoring console includes workload management dashboards that provide insight into various aspects of your workload management deployment, including configuration details and system resource usage.
To view workload management dashboards:
- In Splunk Web, click Settings > Monitoring Console.
- Click Resource Usage > Resource Usage: Instance > Workload Management.
The Workload Management dashboard page opens.
Workload management status dashboard
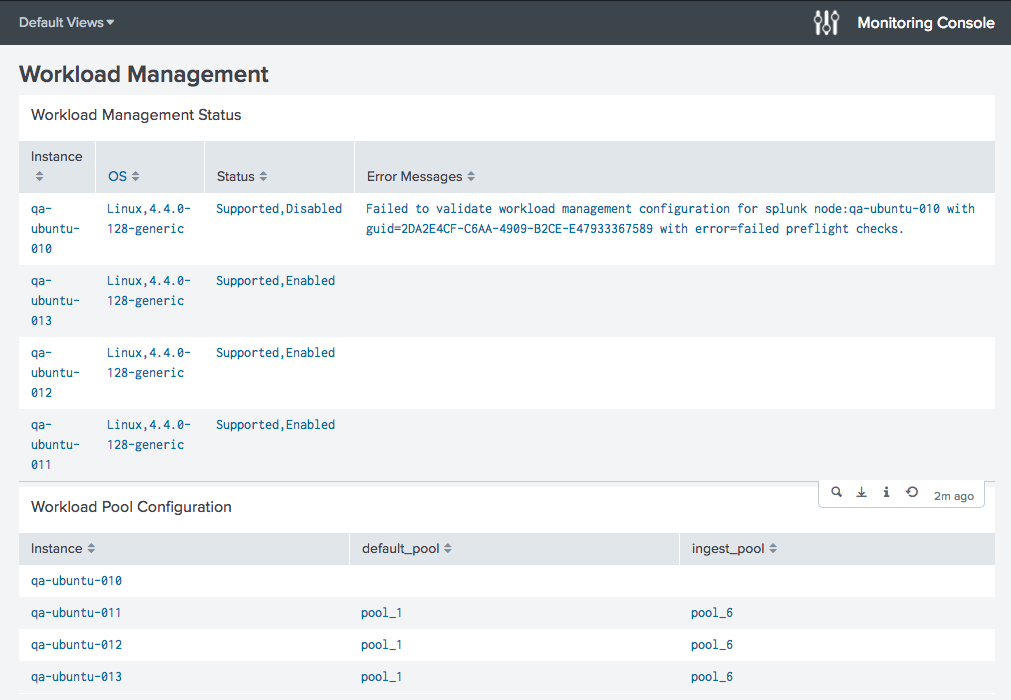
The workload management status dashboard shows information about your deployment, including whether workload management is supported and enabled on individual Linux instances. It also displays error messages and workload pool configuration details.
CPU and memory usage dashboards
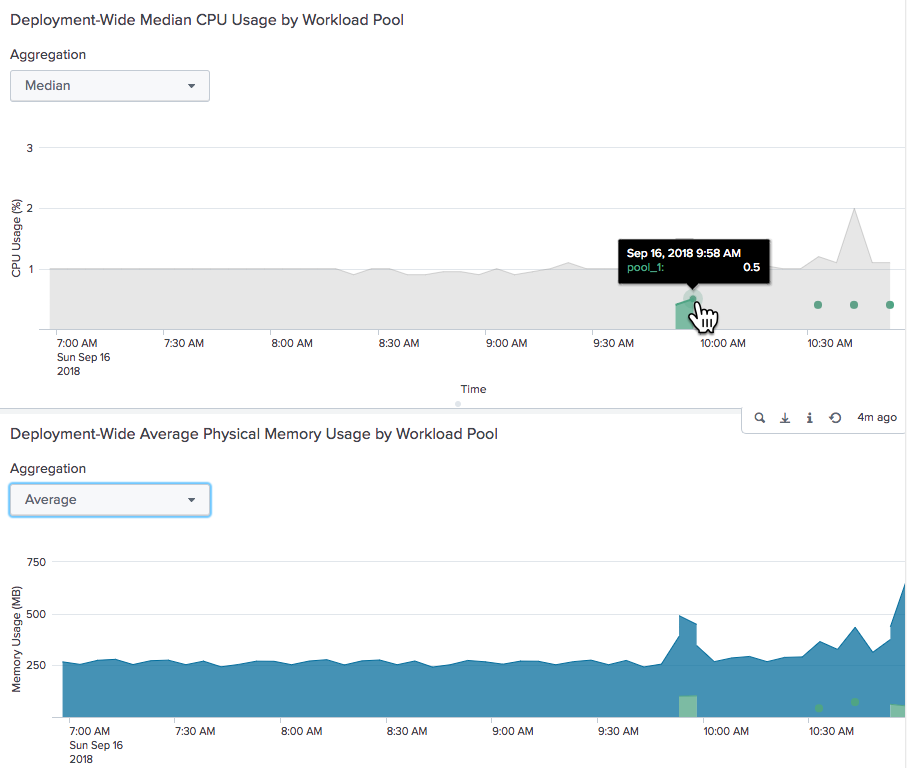
The CPU and memory usage dashboards show resource consumption on a per pool basis. You can use these dashboards to monitor the total amount of resources that assigned search processes are consuming within individual pools.
Monitoring workload pool consumption can help you provision resources efficiently and help you avoid assigning too many searches to a pool, which can impact search performance.
CPU and memory overflow and limits
If a search exceeds the maximum CPU resources allocated to its workload pool, it is considered a soft limit, and the pool can borrow available CPU resources from other pools.
If a search exceeds the maximum memory allocated to its workload pool, it is considered a hard limit, and the pool does not borrow memory from other pools. Instead, memory swaps to disk. If you run out of swap space, splunkd kills the search process.
| Assign searches to workload pools |
This documentation applies to the following versions of Splunk® Enterprise: 7.2.0, 7.2.1, 7.2.2, 7.2.3, 7.2.4, 7.2.5, 7.2.6, 7.2.7, 7.2.8, 7.2.9, 7.2.10


 Download manual
Feedback submitted, thanks!