Identify and triage indexing performance problems
Use this topic to begin to troubleshoot indexing performance problems in Splunk software.
Problems
The following are some symptoms of indexing performance issues:
- Messages in Splunk Web indicate data stalls on indexers or on instances sending data to indexers.
- Forwarders are unable to send data to indexers.
- Receiving ports on indexers are being closed. You might have learned of this by looking at the Splunk TCP Input: Instance Monitoring Console dashboard.
- Event-processing queues are saturated. You might have learned of this from the Monitoring Console Health Check or from a Monitoring Console platform alert.
- Indexing rate is unusually low. You might have learned of this from the Monitoring Console Health Check.
- Data is arriving late. See Event indexing delay.
Gather information
You need three pieces of information to begin to diagnose indexing problems: indexing status, indexing rate, and queue fill pattern.
Before you continue, consider reading How indexing works in Managing Indexers and Clusters of Indexers.
Determine indexing status
The indexer processor can be in one of several states: normal, saturated, throttled, or blocked.
View the current state using any of these methods:
- Monitoring Console health check
- Monitoring Console indexing performance views
- "Saturated event-processing queues" platform alert, included with the Monitoring Console
- server/introspection/indexer endpoint
See About the Monitoring Console in Monitoring Splunk Enterprise.
Determine and categorize the indexing rate
Distinguish between an indexing rate that is nonexistent (0 MB/s), low (1 MB/s), or high (at least several MB/s).
Use the Monitoring Console to determine indexing rate. This information is available in several locations within the Monitoring Console:
- Overview > Topology with the Indexing rate overlay.
- Indexing > Indexing Performance: Deployment.
- Indexing > Indexing Performance: Instance.
Determine queue fill pattern
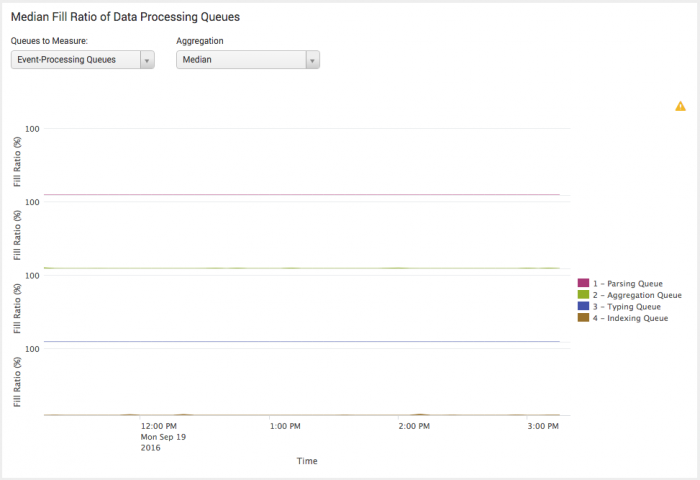
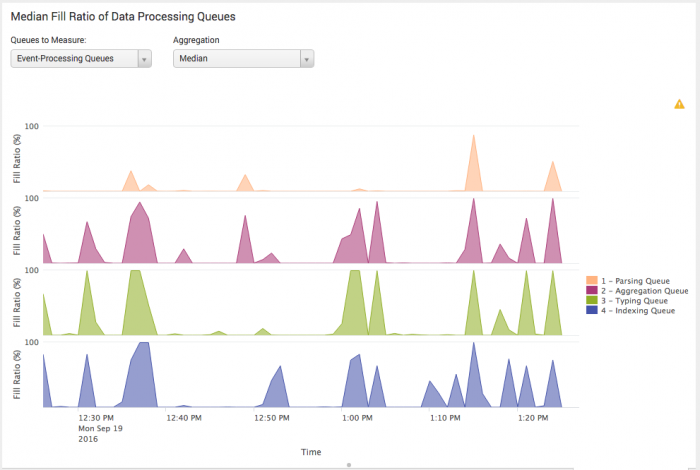
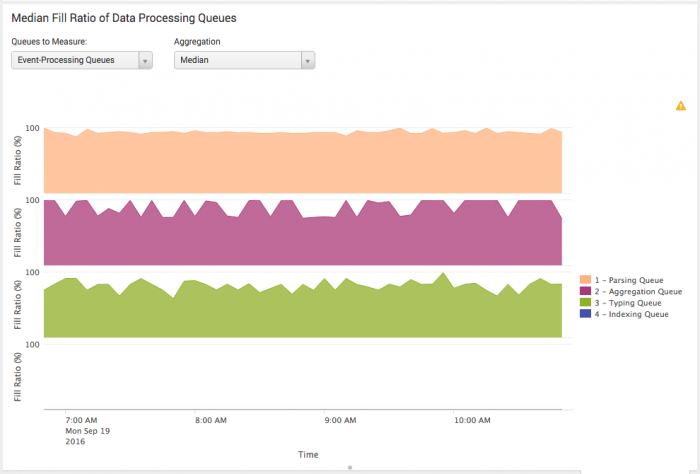
Indexing queue fill profiles can be grouped into three basic shapes. For this diagnosis, differentiate between flat and low, spiky, and saturated.
Indexing is not necessarily "blocked" even if the event-processing queues are saturated.
Use the Monitoring Console to determine the queue fill pattern. See Monitoring Console > Indexing > Indexing Performance: Deployment and also Monitoring Console > Indexing > Indexing Performance: Instance.
Here is an example of a flat and low queue fill pattern.
Here is an example of a spiky but healthy queue fill pattern. Although some of the queues saturate briefly, they recover quickly and completely.
Here is an example of a saturated queue fill pattern.
Causes and solutions
Once you have the three pieces of information from Gather information, use the following table to diagnose your system.
| Indexing status | Indexing rate | Queue fill pattern | Diagnosis | Remedy |
|---|---|---|---|---|
| Normal | Either low or high | Flat or spiky | Your indexer is running normally. | None required. |
| Normal | High | Saturated | Indexers are at or near capacity. | If this behavior persists through all cycles of system usage, you can configure more indexers, parallel pipelines, or high performance storage. See Dimensions of a Splunk Enterprise deployment in the Capacity Planning Manual. |
| Normal | Low | Saturated | Possibilities include:
|
Respectively:
|
| Blocked or throttled | Nonexistent (zero) | Saturated | Possibilities include:
|
Respectively:
|
| SuSE Linux search error | Event indexing delay |
This documentation applies to the following versions of Splunk® Enterprise: 7.0.0, 7.0.1, 7.0.2, 7.0.3, 7.0.4, 7.0.5, 7.0.6, 7.0.7, 7.0.8, 7.0.9, 7.0.10, 7.0.11, 7.0.13, 7.1.0, 7.1.1, 7.1.2, 7.1.3, 7.1.4, 7.1.5, 7.1.6, 7.1.7, 7.1.8, 7.1.9, 7.1.10, 7.2.0, 7.2.1, 7.2.2, 7.2.3, 7.2.4, 7.2.5, 7.2.6, 7.2.7, 7.2.8, 7.2.9, 7.2.10, 7.3.0, 7.3.1, 7.3.2, 7.3.3, 7.3.4, 7.3.5, 7.3.6, 7.3.7, 7.3.8, 7.3.9, 8.0.0, 8.0.1, 8.0.2, 8.0.3, 8.0.4, 8.0.5, 8.0.6, 8.0.7, 8.0.8, 8.0.9, 8.0.10, 8.1.0, 8.1.1, 8.1.2, 8.1.3, 8.1.4, 8.1.5, 8.1.6, 8.1.7, 8.1.8, 8.1.9, 8.1.10, 8.1.11, 8.1.12, 8.1.13, 8.1.14, 8.2.0, 8.2.1, 8.2.2, 8.2.3, 8.2.4, 8.2.5, 8.2.6, 8.2.7, 8.2.8, 8.2.9, 8.2.10, 8.2.11, 8.2.12, 9.0.0, 9.0.1, 9.0.2, 9.0.3, 9.0.4, 9.0.5, 9.0.6, 9.0.7, 9.0.8, 9.0.9, 9.0.10, 9.1.0, 9.1.1, 9.1.2, 9.1.3, 9.1.4, 9.1.5, 9.1.6, 9.1.7, 9.1.8, 9.1.9, 9.2.0, 9.2.1, 9.2.2, 9.2.3, 9.2.4, 9.2.5, 9.2.6, 9.3.0, 9.3.1, 9.3.2, 9.3.3, 9.3.4, 9.4.0, 9.4.1, 9.4.2


 Download manual
Feedback submitted, thanks!