Configure a choropleth map
To review or change choropleth map configuration, select the Format menu and one of the following settings panels.
General
Adjust general settings including initial geographic coordinates and zoom on scroll. You can also opt to hide the map legend.
Colors
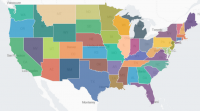
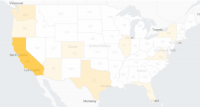
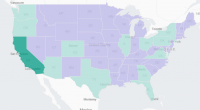
Color mode and data bin settings determine how a choropleth map uses color to visualize data. Select a color mode and configure data bins in the Colors panel.
Color modes
Data bins
Aggregated data values are divided into a set of bins. Each bin corresponds to a specific value range and has a unique color or shade. You can adjust the number of bins and bin color assignments for the selected color mode.
The choropleth map legend to the right of the map shows bins with their colors and value ranges.
Shapes
A shape corresponds to an individual region on a choropleth map. For example, each state in a choropleth map of the United States is a shape. You can adjust shape opacity and borders.
Tiles
Tiles represent map background features, such as oceans. Show or hide tiles.
| Generate a choropleth map | Use IP addresses to generate a choropleth map |
This documentation applies to the following versions of Splunk® Enterprise: 7.0.0, 7.0.1, 7.0.2, 7.0.3, 7.0.4, 7.0.5, 7.0.6, 7.0.7, 7.0.8, 7.0.9, 7.0.10, 7.0.11, 7.0.13, 7.1.0, 7.1.1, 7.1.2, 7.1.3, 7.1.4, 7.1.5, 7.1.6, 7.1.7, 7.1.8, 7.1.9, 7.1.10, 7.2.0, 7.2.1, 7.2.2, 7.2.3, 7.2.4, 7.2.5, 7.2.6, 7.2.7, 7.2.8, 7.2.9, 7.2.10, 7.3.0, 7.3.1, 7.3.2, 7.3.3, 7.3.4, 7.3.5, 7.3.6, 7.3.7, 7.3.8, 7.3.9, 8.0.0, 8.0.1, 8.0.2, 8.0.3, 8.0.4, 8.0.5, 8.0.6, 8.0.7, 8.0.8, 8.0.9, 8.0.10, 8.1.0, 8.1.1, 8.1.2, 8.1.3, 8.1.4, 8.1.5, 8.1.6, 8.1.7, 8.1.8, 8.1.9, 8.1.10, 8.1.11, 8.1.12, 8.1.13, 8.1.14, 8.2.0, 8.2.1, 8.2.2, 8.2.3, 8.2.4, 8.2.5, 8.2.6, 8.2.7, 8.2.8, 8.2.9, 8.2.10, 8.2.11, 8.2.12, 9.0.0, 9.0.1, 9.0.2, 9.0.3, 9.0.4, 9.0.5, 9.0.6, 9.0.7, 9.0.8, 9.0.9, 9.0.10, 9.1.0, 9.1.1, 9.1.2, 9.1.3, 9.1.4, 9.1.5, 9.1.6, 9.1.7, 9.1.8, 9.1.9, 9.2.0, 9.2.1, 9.2.2, 9.2.3, 9.2.4, 9.2.5, 9.2.6, 9.3.0, 9.3.1, 9.3.2, 9.3.3, 9.3.4, 9.4.0, 9.4.1, 9.4.2


 Download manual
Feedback submitted, thanks!