Resource Usage: CPU Usage
This topic is a reference for the Resource Usage: CPU Usage dashboards in the Monitoring Console. See About the Monitoring Console in this manual.
These dashboards consolidate existing CPU usage views from other Monitoring Console pages to provide a central location for monitoring the CPU resource consumption of your Splunk Enterprise Deployment.
CPU Usage: Deployment
The CPU Usage: Deployment dashboard shows physical CPU and virtual CPU (vCPU) usage across your distributed deployment.
To view CPU usage for a specific server role, select the server role from the Role menu.
Snapshot overview
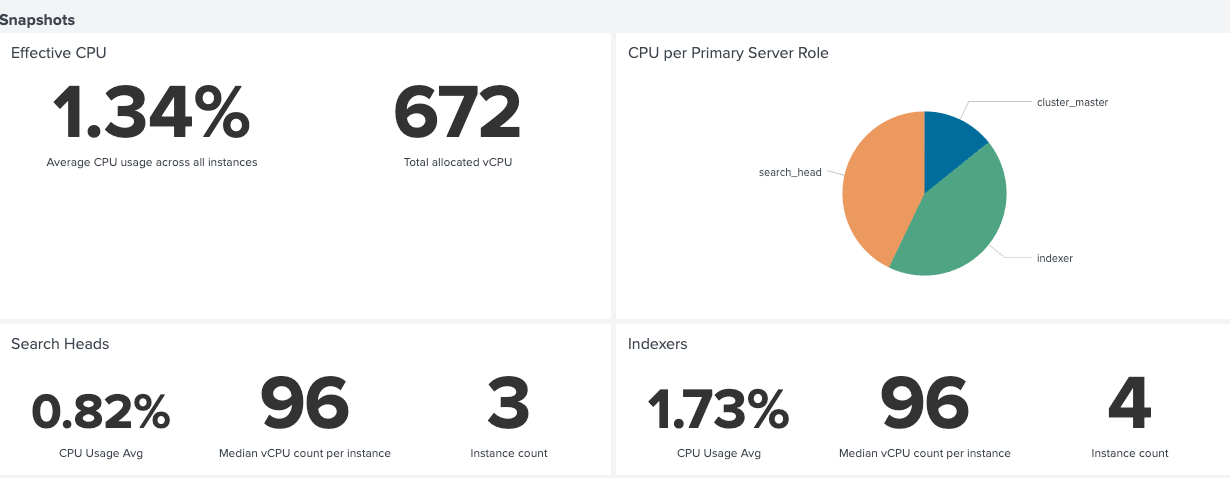
The snapshot view includes the following panels that provide an overview of CPU resources:
- Effective CPU: This panel shows the average CPU usage (%) across all instances in your deployment, as well as the total count of allocated vCPUs. If hyper-threading is on, the vCPU count is equal to twice the number of physical cores. If hyper-threading is off, the vCPU count is equal to the number of physical cores.
- Search Heads: This panel shows the CPU usage and vCPU count across all instances running as search heads.
- Indexers: This panel shows CPU usage and vCPU count across all instances running as indexers.
- CPU per Primary Server Role: This panel shows average CPU usage (% ) and vCPU count based on server role. Use this panel to evaluate the current CPU resource consumption of different server roles.

CPU Usage by Instance
The CPU Usage by Instance panel shows the number of CPU cores (CPU/vCPU), CPU Usage (%), and Load Average for each instance in a distributed deployment. CPU Usage (%) and Load Average columns are color-coded based on the CPU status for each instance, as follows: 0-60 is green, 60-80 is yellow, 80-100 is orange, and 100+ is red.
You can use this panel to track the status of CPU usage across multiple instances, and to maintain awareness of possible CPU overload conditions that can hurt performance. Click on any instance in the list to open the CPU Usage: Instance dashboard, where you can view detailed CPU usage information for that specific instance.

CPU Usage by Primary Server Role over Splunk Process Type
The CPU usage by Primary Server Role over Splunk Process Type panel shows CPU usage of various Splunk process types for each Splunk server role (search head, indexer, cluster master, and so on) in your deployment. Process types include splunkd, search, index service, Splunk Web, KVStore, scripted inputs, and more.
Use this panel to track the amount of CPU resources that different Splunk process types are consuming on a particular Splunk server role.
Click the "Scale x-axis to actual size" check box to maximize the horizontal view.

Deployment-wide Median CPU Usage
The Deployment-wide Median CPU Usage panel shows the total CPU usage % over time across your entire deployment.
You can use this panel to identify trends in overall CPU resource consumption, such as increasing CPU usage, which might indicate an issue with your system that requires investigation.
Median CPU Usage
The Median CPU Usage panel shows CPU % usage over time for individual instances in your deployment.
You can use this panel to identify trends in CPU resource consumption that might indicate an issue with a particular instance.
Median CPU Usage by Process Class
The Median CPU Usage by Process Class panel shows CPU resource usage for each Splunk process class. A "process class" is an aggregate of processes within a single class.
You can use this panel to identify spikes in CPU usage by a particular process, which might indicate an underlying issue. For example, high CPU % usage by scripted inputs might indicate an issue with data ingestion.

Median CPU usage of Searches
The Median CPU usage of Searches panel lets you monitor CPU usage based on variety of search characteristics, including search type (ad hoc, scheduled)search mode (real time, historical), app context, user, role, search name, and so on.
Use this panel to identify spikes in CPU usage that can indicate various issues with search performance. For example, high CPU usage by scheduled searches can suggest issues with search concurrency.
CPU Usage: Instance
The CPU Usage: Instance dashboard lets you monitor physical CPU and vCPU usage of individual instances.
To view CPU usage for a specific instance, select the instance from the Instance menu.
The CPU Usage panel shows the number of physical and virtual CPUs, as well as CPU Usage and Load Average for the selected instance.
The CPU Usage over Splunk Process Type panel shows CPU usage of different Splunk process types for the selected instance.
The Median CPU Usage by Process Class panel show CPU usage for each Splunk Process class on the selected instance.
The Median CPU Usage of Searches panel lets you monitor CPU usage based on variety of search characteristics, including search type (ad hoc, scheduled)search mode (real time, historical), app context, user, role, search name, and so on.
Troubleshoot these dashboards
CPU/vCPU dashboards get CPU usage information from the _introspection index and /server/status/resource-usage/hostwide endpoint. If a panel is missing data, check the following:
- Make sure you are forwarding your introspection logs to your indexers.
- Confirm that your system meets the system requirements for platform instrumentation.
For endpoint information, see /server/status/resource-usage/hostwide in the 'REST API Reference Manual.
| Resource Usage | Forwarders |
This documentation applies to the following versions of Splunk® Enterprise: 7.3.6, 7.3.7, 7.3.8, 7.3.9, 8.0.3
Feedback submitted, thanks!