Monitor workload management using the splunkd health report
The splunkd health report lets you view the status of Splunk Enterprise features from the output of a REST API endpoint. Individual features report their health status through a tree structure that provides a continuous, real-time view of the health of your deployment.
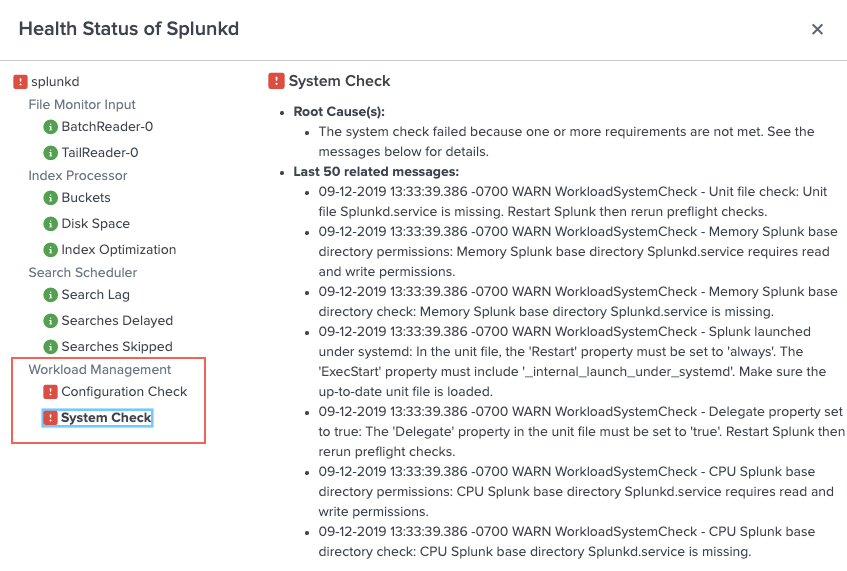
The splunkd health report provides the following features for monitoring workload management:
- System check: Checks whether the underlying Linux operating system is set up properly for workload management.
- Configuration checks: Checks whether the workload management configuration, including pools and rules, is valid.
You can use the health report to identify and investigate health status changes that might indicate a problem with your underlying Linux system or workload management configuration.
View workload management status in the health report
You can view the status of workload management features in the splunkd health report in Splunk Web. For instructions on how to view the health report and investigate issues, see Investigate feature health status changes in Monitoring Splunk Enterprise.
You can also access workload management feature health information programmatically from the server/health/splunkd endpoint. See Query the server/health/splunkd endpoint.
The splunkd health report checks workload management feature status only when workload management is set to enabled in Splunk Enterprise.
The splunkd health report shows workload management health status on the local instance on which you are monitoring only.
For more information on the splunkd health report, see About proactive Splunk component monitoring in Monitoring Splunk Enterprise.
| Monitor workload management using the monitoring console | Upgrade workload management |
This documentation applies to the following versions of Splunk® Enterprise: 8.0.0, 8.0.1, 8.0.2, 8.0.3, 8.0.4, 8.0.5, 8.0.6, 8.0.7, 8.0.8, 8.0.9, 8.0.10, 8.1.0, 8.1.1, 8.1.2, 8.1.3, 8.1.4, 8.1.5, 8.1.6, 8.1.7, 8.1.8, 8.1.9, 8.1.10, 8.1.11, 8.1.12, 8.1.13, 8.1.14, 8.2.0, 8.2.1, 8.2.2, 8.2.3, 8.2.4, 8.2.5, 8.2.6, 8.2.7, 8.2.8, 8.2.9, 8.2.10, 8.2.11, 8.2.12, 9.0.0, 9.0.1, 9.0.2, 9.0.3, 9.0.4, 9.0.5, 9.0.6, 9.0.7, 9.0.8, 9.0.9, 9.0.10, 9.1.0, 9.1.1, 9.1.2, 9.1.3, 9.1.4, 9.1.5, 9.1.6, 9.1.7, 9.1.8, 9.1.9, 9.2.0, 9.2.1, 9.2.2, 9.2.3, 9.2.4, 9.2.5, 9.2.6, 9.3.0, 9.3.1, 9.3.2, 9.3.3, 9.3.4, 9.4.0, 9.4.1, 9.4.2

 Download manual
Feedback submitted, thanks!