concurrency
Description
Concurrency measures the number of events which have spans that overlap with the start of each event. Alternatively, this measurement represents the total number of events in progress at the time that each particular event started, including the event itself. This command does not measure the total number of events that a particular event overlapped with during its total span.
Syntax
concurrency duration=<field> [start=<field>] [output=<field>]
Required arguments
- duration
- Syntax: duration=<field>
- Description: A field that represents a span of time. This field must be a numeric with the same units as the start field. For example, the duration field generated by the transaction command is in seconds (see Example 1), which can be used with the default of
_timewhich is also in units of seconds.
Optional arguments
- start
- Syntax: start=<field>
- Description: A field that represents the start time.
- Default:
_time
- output
- Syntax: output=<field>
- Description: A field to write the resulting number of concurrent events.
- Default: "concurrency"
Usage
The concurrency command is a dataset processing command. See Command types.
An event X is concurrent with event Y if X.start is between Y.start and (Y.start + Y.duration)
If your events have a time that represents event completion and a span that represents the time before the completion, you need to subtract duration from the start time before the concurrency command:
... |eval new_start = start - duration | concurrency start=new_start duration=duration
Limits
There is a limitation on quantity of overlapping items. If the maximum tracked concurrency exceeds max_count, from the [concurrency] stanza in limits.conf, a warning will be produced in the UI / search output, and the values will be clamped, making them potentially inaccurate. This limit defaults to 10000000 or ten million.
Basic examples
1. Determine the number of overlapping HTTP requests
Determine the number of overlapping HTTP requests outstanding from browsers accessing splunkd at the time that each http request begins.
This relies on the fact that the timestamp of the logged message is the time that the request came in, and the 'spent' field is the number of milliseconds spent handling the request. As always, you must be an 'admin' user, or have altered your roles scheme in order to access the _internal index.
index=_internal sourcetype=splunkd_ui_access | eval spent_in_seconds = spent / 1000 | concurrency duration=spent_in_seconds
2. Calculate the number of concurrent events
Calculate the number of concurrent events for each event and emit as field 'foo':
... | concurrency duration=total_time output=foo
3. Use existing fields to specify the start time and duration
Calculate the number of concurrent events using the 'et' field as the start time and 'length' as the duration:
... | concurrency duration=length start=et
Extended examples
1. Count the transactions that occurred at the same time
| This example uses the sample data from the Search Tutorial. To try this example on your own Splunk instance, you must download the sample data and follow the instructions to get the tutorial data into Splunk. Use the time range All time when you run the search. |
Use the duration or span of a transaction to count the number of other transactions that occurred at the same time.
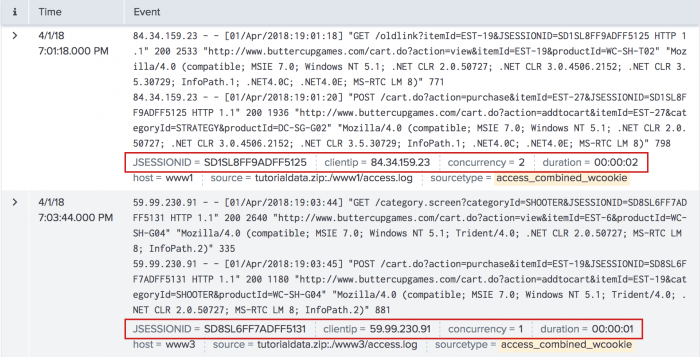
sourcetype=access_* | transaction JSESSIONID clientip startswith="view" endswith="purchase" | concurrency duration=duration | eval duration=tostring(duration,"duration")
- This search groups events into transactions if they have the same values of
JSESSIONIDandclientip. An event is the beginning of the transaction if the event contains the string "view". An event is the last event of the transaction if the event contains the string "purchase". - The
transactioncommand returns a field called duration. - The transactions are then piped into the
concurrencycommand, which counts the number of events that occurred at the same time based on the timestamp anddurationof the transaction. - The search also uses the
evalcommand and thetostring()function to reformat the values of thedurationfield to a more readable format, HH:MM:SS.

To see the values in each transaction for the JSESSIONID, clientip, concurrency, and duration fields:
- In the list of Interesting Fields, click the field name.
- In the information box, for Selected, click Yes.
- Select the next field in the list of Interesting Fields. The information box automatically refreshes. For Selected, click Yes.
- Repeat these steps for every field you want to appear in the result list.
The results should appear similar to the following image:

2. Count the purchases that occurred at the same time
| This example uses the sample data from the Search Tutorial. To try this example on your own Splunk instance, you must download the sample data and follow the instructions to get the tutorial data into Splunk. Use the time range All time when you run the search. |
Use the time between each purchase to count the number of different purchases that occurred at the same time.
sourcetype=access_* action=purchase | delta _time AS timeDelta p=1 | eval timeDelta=abs(timeDelta) | concurrency duration=timeDelta
- This search uses the
deltacommand and the_timefield to calculate the time between one purchase event (action=purchase) and the purchase event immediately preceding it. - The search renames this change in time as
timeDelta. - Some of the values of
timeDeltaare negative. Because theconcurrencycommand does not work with negative values, theevalcommand is used to redefinetimeDeltaas its absolute value (abs(timeDelta)). - The
timeDeltais then used as thedurationfor calculating concurrent events.

3. Calculate the transactions using the time between consecutive transactions
| This example uses the sample data from the Search Tutorial. To try this example on your own Splunk instance, you must download the sample data and follow the instructions to get the tutorial data into Splunk. Use the time range All time when you run the search. |
Use the time between each consecutive transaction to calculate the number of transactions that occurred at the same time.
sourcetype=access_* | transaction JSESSIONID clientip startswith="view" endswith="purchase" | delta _time AS timeDelta p=1 | eval timeDelta=abs(timeDelta) | concurrency duration=timeDelta | eval timeDelta=tostring(timeDelta,"duration")
- This search groups events into transactions if they have the same values of
JSESSIONIDandclientip. An event is the beginning of the transaction if the event contains the string "view". An event is the last event of the transaction if the event contains the string "purchase". - The
transactioncommand returns a field called duration. - The transactions are then piped into the
deltacommand, which uses the_timefield to calculate the time between one transaction and the transaction immediately preceding it. - The search renames this change in time as
timeDelta. - Some of the values of
timeDeltaare negative. Because theconcurrencycommand does not work with negative values, theevalcommand is used to redefinetimeDeltaas its absolute value (abs(timeDelta)). - This
timeDeltais then used as thedurationfor calculating concurrent transactions.

See also
| collect | contingency |
This documentation applies to the following versions of Splunk® Enterprise: 7.0.0, 7.0.1, 7.0.2, 7.0.3, 7.0.4, 7.0.5, 7.0.6, 7.0.7, 7.0.8, 7.0.9, 7.0.10, 7.0.11, 7.0.13, 7.1.0, 7.1.1, 7.1.2, 7.1.3, 7.1.4, 7.1.5, 7.1.6, 7.1.7, 7.1.8, 7.1.9, 7.1.10, 7.2.0, 7.2.1, 7.2.2, 7.2.3, 7.2.4, 7.2.5, 7.2.6, 7.2.7, 7.2.8, 7.2.9, 7.2.10, 7.3.0, 7.3.1, 7.3.2, 7.3.3, 7.3.4, 7.3.5, 7.3.6, 7.3.7, 7.3.8, 7.3.9, 8.0.0, 8.0.1, 8.0.2, 8.0.3, 8.0.4, 8.0.5, 8.0.6, 8.0.7, 8.0.8, 8.0.9, 8.0.10, 8.1.0, 8.1.1, 8.1.2, 8.1.3, 8.1.4, 8.1.5, 8.1.6, 8.1.7, 8.1.8, 8.1.9, 8.1.10, 8.1.11, 8.1.12, 8.1.13, 8.1.14, 8.2.0, 8.2.1, 8.2.2, 8.2.3, 8.2.4, 8.2.5, 8.2.6, 8.2.7, 8.2.8, 8.2.9, 8.2.10, 8.2.11, 8.2.12, 9.0.0, 9.0.1, 9.0.2, 9.0.3, 9.0.4, 9.0.5, 9.0.6, 9.0.7, 9.0.8, 9.0.9, 9.0.10, 9.1.0, 9.1.1, 9.1.2, 9.1.3, 9.1.4, 9.1.5, 9.1.6, 9.1.7, 9.1.8, 9.1.9, 9.2.0, 9.2.1, 9.2.2, 9.2.3, 9.2.4, 9.2.5, 9.2.6, 9.3.0, 9.3.1, 9.3.2, 9.3.3, 9.3.4, 9.4.0, 9.4.1, 9.4.2
Feedback submitted, thanks!