Time range in the Analytics Workspace
To help you compare time series, all charts in the workspace show the same time range. Hover over any chart to view a shared hairline.
The default time range for the workspace is one hour. Adjust the time range to gain more insight from your charts. If you notice a significant change in your data around an approximate time, narrow the time range to refine your analysis. If you want to see a broader selection of data points, expand the time range to show trends over a longer period of time.
Modifying the workspace time range adjusts the portion of the index that you are analyzing. This change affects how aggregations are calculated on charts. For more information about how the time range affects data point calculations, see Analytics in the Analytics Workspace.
Set the workspace time range
Set the time range through either the time range picker or by zooming in on a chart.
Use the time range picker
Use the time range picker to adjust the time range for all charts in the Analytics Workspace.
- From the global actions bar of the Analytics Workspace, click the time range picker.
- Select a preset time range from the list or when one of the preset time ranges is not precise enough for your search, select Custom... and enter a relative or specific date and time range.
Custom time ranges
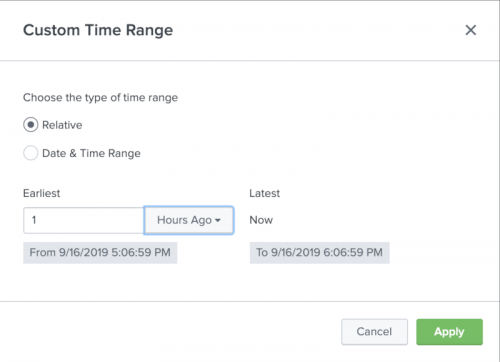
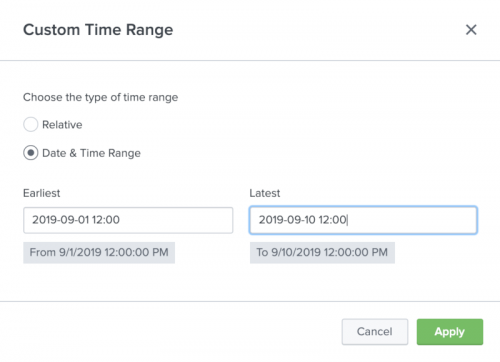
You can use the Relative option to specify a custom time range relative to the current time. You can use the Date & Time Range option to specify a specific custom time range.
- Click on the time range drop-down menu and select Custom....
- If you want to view metrics in a time range relative to "now", select Relative and enter the earliest date and time you want to view. Relative time must be entered as an integer value.
- If you want to view metrics in a specific time range, select Date & Time Range and enter the start and end dates and times. Date & Time Range supports all valid date and time formats. See Time modifiers for more information on the supported date and time formats.
- Click Apply.


See Specifying time ranges for more information on specifying time ranges.
Zoom in to a custom time range
Zoom in to a custom time range to analyze data from a specific time period.
- Select a chart in the workspace to zoom in on.
- Click and drag your cursor over the time period you want to view.
All charts show your selected time range.
To undo the zoom, click the back arrow in the top-left corner of the main panel. The time range reverts to the previous setting.
This documentation applies to the following versions of Splunk® Enterprise: 8.0.0, 8.0.1, 8.0.2, 8.0.3, 8.0.4, 8.0.5, 8.0.6, 8.0.7, 8.0.8, 8.1.0, 8.1.1
Feedback submitted, thanks!