Write better searches
This topic examines some causes of slow searches and includes guidelines to help you write searches that run more efficiently. Many factors can affect the speed of your searches, including:
- The volume of data that you are searching
- How your searches are constructed
- The number of concurrent searches
To optimize the speed at which your search runs, minimize the amount of processing time required by each component of the search.
Know your type of search
The recommendations for optimizing searches depend on the type of search that you run and the characteristics of the data you are searching. Searches fall into two types, that are based on the goal you want to accomplish. Either a search is designed to retrieve events or a search is designed to generate a report that summarizes or organizes the data.
See Types of searches.
Searches that retrieve events
Raw event searches retrieve events from a Splunk index without any additional processing of the events that are retrieved. When retrieving events from the index, be specific about the events that you want to retrieve. You can do this with keywords and field-value pairs that are unique to the events.
If the events you want to retrieve occur frequently in the dataset, the search is called a dense search. If the events you want to retrieve are rare in the dataset, the search is called a sparse search. Sparse searches that run against large volumes of data take longer than dense searches against the same data set.
See Use fields to retrieve events.
Searches that generate reports
Report-generating searches, or transforming searches, perform additional processing on events after the events are retrieved from an index. This processing can include filtering, transforming, and other operations using one or more statistical functions against the set of results. Because this processing occurs in memory, the more restrictive and specific you are retrieving the events, the faster the search will run.
See About transformating commands and searches.
Command types and parallel processing
Some commands process events in a stream. There is one event in and one, or no, event out. These are referred to as streaming commands. Examples of streaming commands are where, eval, lookup, and search.
Other commands require all of the events from all of the indexers before the command can finish. These are referred to as non-streaming commands. Examples of non-streaming commands are stats, sort, dedup, top, and append.
Non-streaming commands can run only when all of the data is available. To process non-streaming commands, all of the search results from the indexers are sent to the search head. When this happens, all further processing must be performed by the search head, rather than in parallel on the indexers.
Parallel processing example
Non-streaming commands that are early in your search reduce parallel processing.
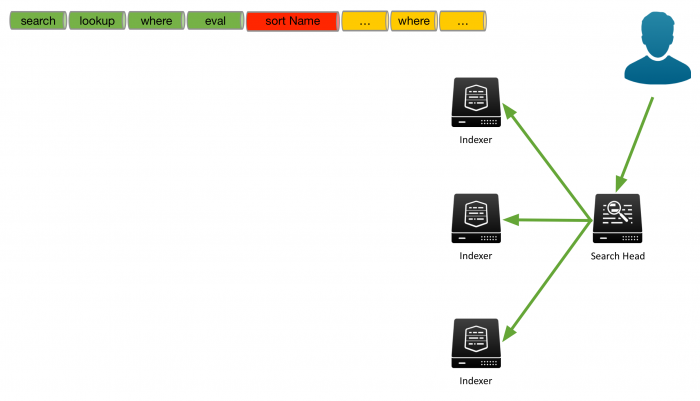
For example, the following image shows a search that a user has run. The search starts with the search command, which is implied as the first command in the Search bar. The search continues with the lookup, where, and eval commands. The search then contains a sort, based on the Name field, followed by another where command.
The search is sent to the search head and distributed to the indexers to process as much of the search as possible on the indexers.
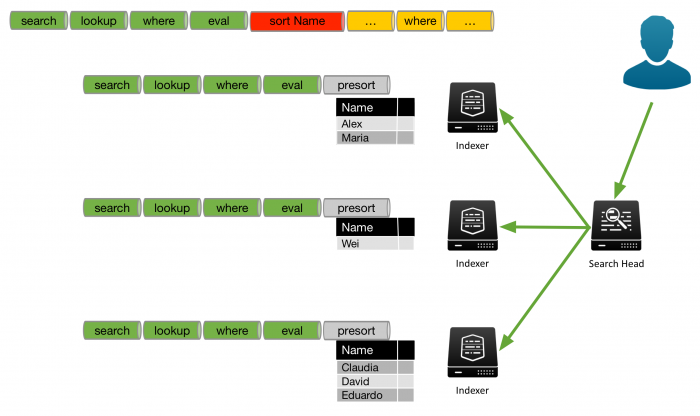
For the events that are on each indexer, the indexer processes the search until the indexer encounters a non-streaming command. In this example, the indexers process the search through the eval command. To perform the sort, all of the results must be sent to the search head for processing.
However, the results that are on each indexer can be sorted by the indexer. This is referred to as a presort. In this example the sort is on the Name field. The following image shows that the first indexer returns the names Alex and Maria. The second indexer returns the name Wei. The third indexer returns the names Claudia, David, and Eduardo.
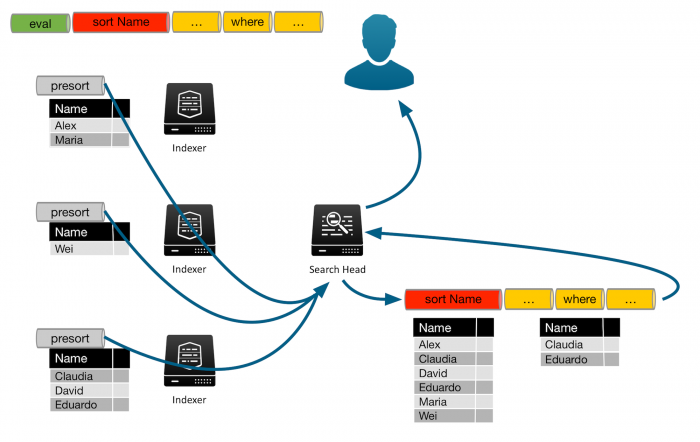
To return the full list of results sorted by name, all of the events that match the search criteria must be sent to the search head. When all of the results are on the search head, the rest of the search must be processed on the search head. In this example the sort and any remaining commands are processed on the search head.
The following image shows that each indexer has presorted the results, based on the Name field. The results are sent to the search head, and are appended together. The search head then sorts the entire list into the correct order. The search head processes the remaining commands in the search to produce the final results. In this example, that includes the second where command. The final results are returned to the user.
When part or all of a search is run on the indexers, the search processes in parallel and search performance is much quicker.
To optimize your searches, place non-streaming commands as late as possible in your search string.
Tips for tuning your searches
In most cases, your search is slow because of the complexity of your query to retrieve events from index. For example, if your search contains extremely large OR lists, complex subsearches (which break down into OR lists), and types of phrase searches, it takes longer to process. This section discusses some tips for tuning your searches so that they are more efficient.
Performing statistics with a BY clause on a set of field values that have a high cardinality, lots of uncommon or unique values, requires a lot of memory. One possible remedy is to decrease the value for the chunk_size setting used with the tstats command. Additionally, reducing the number of distinct values that the BY clause must process can also be beneficial.
Restrict searches to the specific index
If you rarely search across more than one type of data at a time, partition your different types of data into separate indexes. Then restrict your searches to the specific index. For example, store Web access data in one index and firewall data in another. This is recommended for sparse data, which might otherwise be buried in a large volume of unrelated data.
See Create custom indexes in Managing Indexers and Clusters of Indexers and Retrieve events from indexes in this manual.
Use fields effectively
Searches with fields are faster when they use fields that have already been extracted (indexed fields) instead of fields extracted at search time. For more information about indexed fields and default fields, see About fields in the Knowledge Manager Manual.
Use indexed and default fields
Use indexed and default fields whenever you can to help search or filter your data efficiently. At index time, Splunk software extracts a set of default fields that are common to each event. These fields include host, source, and sourcetype. Use these fields to filter your data as early as possible in the search so that processing is done on a minimum amount of data.
For example, if you're building a report on web access errors, search for those specific errors before the reporting command:
sourcetype=access_* (status=4* OR status=5*) | stats count by status
Specify indexed fields with <field>::<value>
You can also run efficient searches for fields that have been indexed from structured data such as CSV files and JSON data sources. When you do this, replace the equal sign with double colons, like this: <field>::<value>.
This syntax works best in searches for fields that have been indexed from structured data, though it can be used to search for default and custom indexed fields as well. You cannot use it to search on search-time fields.
Disable field discovery to improve search performance
If you don't need additional fields in your search, set Search Mode to a setting that disables field discovery to improve search performance in the timeline view or use the fields command to specify only the fields that you want to see in your results.
However, disabling field discovery prevents automatic field extraction, except for fields that are required to fulfill your search, such as fields that you are specifically searching on and default fields such as _time, host, source, and sourcetype. The search runs faster because Splunk software is no longer trying to extract every field possible from your events.
Search mode is set to Smart by default. Set the search mode to Verbose if you are running searches with reporting commands, you don't know what fields exist in your data, and think you might need the fields to help you narrow down your search.
See Set search modes.
Also see the topic about the fields command in the Search Reference.
Summarize your data
It can take a lot of time to search through very large data sets. If you regularly generate reports on large volumes of data, use summary indexing to pre-calculate the values that you use most often in your reports. Schedule saved searches to collect metrics on a regular basis, and report on the summarized data instead of on raw data.
See Use summary indexing for increased reporting efficiency.
Use the Search Job Inspector
The Search Job Inspector is a tool you can use both to troubleshoot the performance of a search and to determine which phase of the search takes the greatest amounts of time. It dissects the behavior of your searches to help you understand the execution costs of knowledge objects such as event types, tags, lookups, search commands, and other components within the search.
See View search job properties in this manual.
See also
| Quick tips for optimization | Built-in optimization |
This documentation applies to the following versions of Splunk® Enterprise: 7.1.0, 7.1.1, 7.1.2, 7.1.3, 7.1.4, 7.1.5, 7.1.6, 7.1.7, 7.1.8, 7.1.9, 7.1.10, 7.2.0, 7.2.1, 7.2.2, 7.2.3, 7.2.4, 7.2.5, 7.2.6, 7.2.7, 7.2.8, 7.2.9, 7.2.10, 7.3.0, 7.3.1, 7.3.2, 7.3.3, 7.3.4, 7.3.5, 7.3.6, 7.3.7, 7.3.8, 7.3.9, 8.0.0, 8.0.1, 8.0.2, 8.0.3, 8.0.4, 8.0.5, 8.0.6, 8.0.7, 8.0.8, 8.0.9, 8.0.10, 8.1.0, 8.1.1, 8.1.2, 8.1.3, 8.1.4, 8.1.5, 8.1.6, 8.1.7, 8.1.8, 8.1.9, 8.1.10, 8.1.11, 8.1.12, 8.1.13, 8.1.14, 8.2.0, 8.2.1, 8.2.2, 8.2.3, 8.2.4, 8.2.5, 8.2.6, 8.2.7, 8.2.8, 8.2.9, 8.2.10, 8.2.11, 8.2.12, 9.0.0, 9.0.1, 9.0.2, 9.0.3, 9.0.4, 9.0.5, 9.0.6, 9.0.7, 9.0.8, 9.0.9, 9.0.10, 9.1.0, 9.1.1, 9.1.2, 9.1.3, 9.1.4, 9.1.5, 9.1.6, 9.1.7, 9.1.8, 9.1.9, 9.2.0, 9.2.1, 9.2.2, 9.2.3, 9.2.4, 9.2.5, 9.2.6, 9.3.0, 9.3.1, 9.3.2, 9.3.3, 9.3.4, 9.4.0, 9.4.1, 9.4.2


 Download manual
Feedback submitted, thanks!