About dashboards
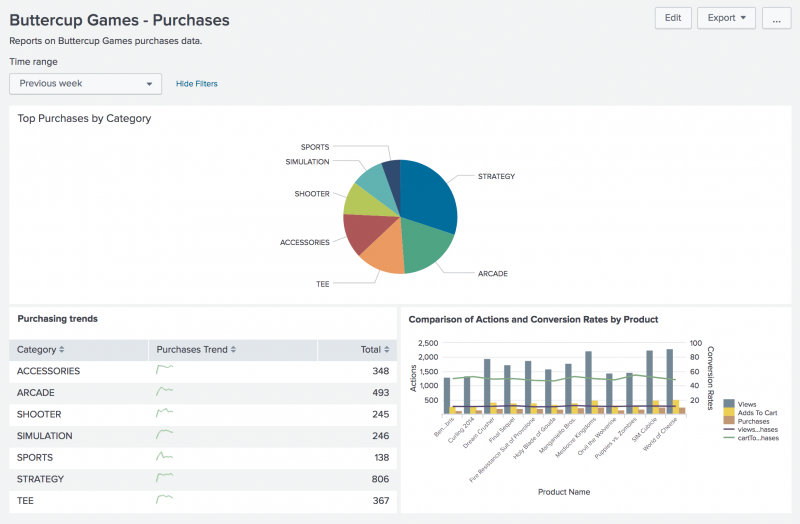
Dashboards are views that are made up of panels. The panels can contain modules such as search boxes, fields, charts, tables, and lists. Dashboard panels are usually connected to reports.
After you create a search visualization or save a report, you can add it to a new or existing dashboard. There is also a Dashboard Editor that you can use to create and edit dashboards. The Dashboard Editor is useful when you have a set of saved reports that you want to quickly add to a dashboard.
Here is an example of dashboard.

Change dashboard permissions
You can grant access to a dashboard from the Dashboard Editor. However, your user role and capabilities defined for that role might limit the type of access you can define.
If your Splunk user role is admin (with the default set of capabilities), then you can create dashboards that are private, visible in a specific app, or visible in all apps. You can also provide access to other Splunk user roles, such as user, admin, and other roles with specific capabilities.
Change dashboard panel visualizations
After you create a panel with the Dashboard Editor, use the Visualization Editor to change the visualization type in the panel, and to specify how the visualization displays and behaves.
Edit the XML configuration of a dashboard
You can edit the panels in a dashboard by editing the XML configuration for the dashboard. This provides access to features not available from the Dashboard Editor. For example, you can edit the XML configuration to change the name of dashboard, or you can specify a custom number of rows in a table.
Next step
Now let's create dashboards and dashboard panels that are based on searches and reports.
See also
In Dashboards and Visualizations:
- Dashboards Quick Reference Guide
- Visualization reference
- Data structure requirements for visualizations
In the Admin Manual:
| Create a report from a sparkline chart | Create dashboards and panels |
This documentation applies to the following versions of Splunk® Enterprise: 7.0.0, 7.0.1, 7.0.2, 7.0.3, 7.0.4, 7.0.5, 7.0.6, 7.0.7, 7.0.8, 7.0.9, 7.0.10, 7.0.11, 7.0.13, 7.1.0, 7.1.1, 7.1.2, 7.1.3, 7.1.4, 7.1.5, 7.1.6, 7.1.7, 7.1.8, 7.1.9, 7.1.10, 7.2.0, 7.2.1, 7.2.2, 7.2.3, 7.2.4, 7.2.5, 7.2.6, 7.2.7, 7.2.8, 7.2.9, 7.2.10, 7.3.0, 7.3.1, 7.3.2, 7.3.3, 7.3.4, 7.3.5, 7.3.6, 7.3.7, 7.3.8, 7.3.9, 8.0.0, 8.0.1, 8.0.2, 8.0.3, 8.0.4, 8.0.5, 8.0.6, 8.0.7, 8.0.8, 8.0.9, 8.0.10, 8.1.0, 8.1.1, 8.1.2, 8.1.3, 8.1.4, 8.1.5, 8.1.6, 8.1.7, 8.1.8, 8.1.9, 8.1.10, 8.1.11, 8.1.12, 8.1.13, 8.1.14
 Download manual
Feedback submitted, thanks!