Developer tools for modular inputs
REST API access
The Splunk platform provides REST endpoints to access modular inputs installed on a Splunk server. You can access the REST endpoint using the manager port of Splunk Web.
https://localhost:8089/services/data/modular-inputs
https://localhost:8089/services/data/modular-inputs/{name}
Details of the endpoints are available from the REST API Reference Manual, which the following list links to.
- data/modular-inputs
- Lists all modular inputs
- data/modular-inputs/{name}
- Provides details on a specific modular endpoint.
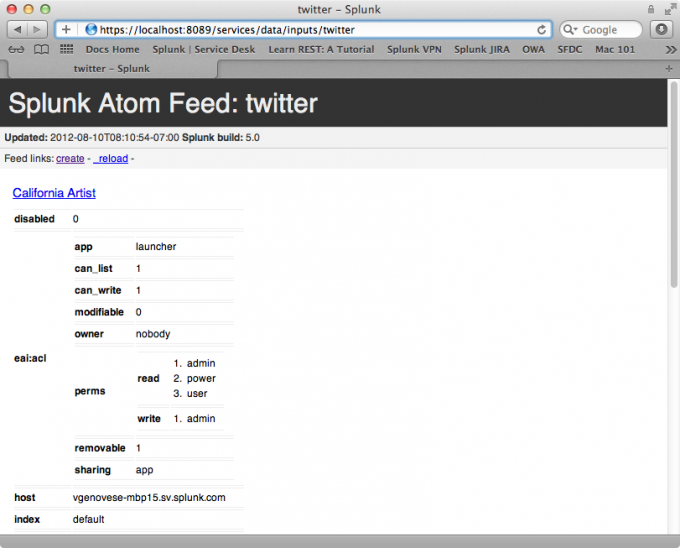
The following screen capture shows how Splunk Web displays the return values from the data/modular-inputs/twitter endpoint, which is theTwitter example application.
Modular inputs configuration utility
When developing a modular input script, it is useful to run the script in isolation, outside of the context of the Splunk server. You can do this using the Splunk utility, print-modinput-config. With this utility you can:
- View the configuration XML generated from a stanza in
inputs.conf. - View verbose debugging information.
- Pipe the configuration into an instance of the script to preview the output
Print modular inputs configurations
Use the Splunk utility, print-modinput-config to print the XML configuration for a modular input. Here is how you call the command for a script named myscript.py with the specified stanza in inputs.conf.
splunk cmd splunkd print-modinput-config myscheme mystanza
- Note: You can run the script with the
--debugparameter to view verbose debugging information generated by your script.
For example, suppose you have a modular input script, twitter.py and the following stanza for the script in your inputs.conf file:
inputs.conf
[twitter://SplunkTwitter]
password = pass
username = splunker
Run the utility to view the configuration for this input:
splunk cmd splunkd print-modinput-config twitter twitter://SplunkTwitter
<?xml version="1.0" encoding="UTF-8"?>
<input>
  <server_host>vgenovese-mbp15.sv.splunk.com</server_host>
  <server_uri>https://127.0.0.1:8089</server_uri>
  <session_key>035ec937131efaa14116dffcdd3f3fe6</session_key>
  <checkpoint_dir>/Applications/splunk/var/lib/splunk/modinputs/twitter</checkpoint_dir>
  <configuration>
    <stanza name="twitter://SplunkTwitter">
      <param name="host">vgenovese-mbp15.sv.splunk.com</param>
      <param name="index">default</param>
      <param name="password">pass</param>
      <param name="username">splunker</param>
    </stanza>
  </configuration>
</input>
This is the configuration information that Splunk software passes to your script when the script is invoked. You can then pipe this configuration information back into your script. This simulates running the modular input script under splunkd and can be used to debug the event stream output..
splunk cmd splunkd print-modinput-config twitter twitter://SplunkTwitter \
| splunk cmd python $SPLUNK_HOME/etc/apps/twitter/bin/twitter.py
DEBUG XML: found configuration
DEBUG XML: found stanza twitter://SplunkTwitter
. . .
{"user": {"default_profile": false, "id_str": "22268633", "statuses_count": 27 \
03, "location": "Ja\u00e9n, Andalucia, Spain", "profile_background_image_url": \
 "http://a0.twimg.com/profile_background_images/451794773/afhbanner.jpg", "fol \
lowers_count": 933, "id": 22268633, "contributors_enabled": false, "follow_req \
uest_sent": null, "profile_background_tile": true, "is_translator": false, "pr \
ofile_sidebar_border_color": "99CC5C", "profile_image_url_https": "https://si0 \
. . .
Debug mode for printing modular inputs configuration
You can run the modular inputs configuration script in debug mode to get verbose debugging information for all modular inputs configurations on your system.
For example, specify the following to view debug information for the Splunk Twitter example. Debug prints information, not just for the Twitter example, but for additional modular inputs on your system. The results for S3 modular inputs have been elided for brevity.
splunk cmd splunkd print-modinput-config --debug twitter twitter://SplunkTwitter
Found scheme="s3".
Locating script for scheme="s3"...
. . .
Introspection setup completed for scheme "s3".
===================================================
Found scheme="twitter".
Locating script for scheme="twitter"...
No regular file="/Applications/splunk/etc/apps/twitter/darwin_x86_64/bin/twitter.sh".
No regular file="/Applications/splunk/etc/apps/twitter/darwin_x86_64/bin/twitter.py".
No regular file="/Applications/splunk/etc/apps/twitter/darwin_x86_64/bin/twitter".
No script found in dir="/Applications/splunk/etc/apps/twitter/darwin_x86_64/bin"
No regular file="/Applications/splunk/etc/apps/twitter/bin/twitter.sh".
Found script "/Applications/splunk/etc/apps/twitter/bin/twitter.py" to handle scheme "twitter".
XML scheme path "/scheme/title": "title" -> "Twitter"
XML scheme path "/scheme/description": "description" -> "Get data from Twitter."
XML scheme path "/scheme/use_external_validation": "use_external_validation" -> "true"
XML scheme path "/scheme/streaming_mode": "streaming_mode" -> "simple"
XML arg path  "/scheme/endpoint/args/arg": "name" -> "name"
XML arg path  "/scheme/endpoint/args/arg/title": "title" -> "Twitter feed name"
XML arg path  "/scheme/endpoint/args/arg/description": "description" -> "Name of the current feed using the user credentials supplied."
XML arg path  "/scheme/endpoint/args/arg": "name" -> "username"
XML arg path  "/scheme/endpoint/args/arg/title": "title" -> "Twitter ID/Handle"
XML arg path  "/scheme/endpoint/args/arg/description": "description" -> "Your Twitter ID."
XML arg path  "/scheme/endpoint/args/arg": "name" -> "password"
XML arg path  "/scheme/endpoint/args/arg/title": "title" -> "Password"
XML arg path  "/scheme/endpoint/args/arg/description": "description" -> "Your twitter password"
Setting up values from introspection for scheme "twitter".
Setting "title" to "Twitter".
Setting "description" to "Get data from Twitter.".
Setting "use_external_validation" to true.
Setting "streaming_mode" to "simple".
Endpoint argument settings for "name":
Setting "title" to "Twitter feed name".
Setting "description" to "Name of the current feed using the user credentials supplied.".
Endpoint argument settings for "password":
Setting "title" to "Password".
Setting "description" to "Your twitter password".
Endpoint argument settings for "username":
Setting "title" to "Twitter ID/Handle".
Setting "description" to "Your Twitter ID.".
Introspection setup completed for scheme "twitter".
<?xml version="1.0" encoding="UTF-8"?>
<input>
  <server_host>vgenovese-mbp15.local</server_host>
  <server_uri>https://127.0.0.1:8089</server_uri>
  <session_key>8586adf254cce215630e8c022d1f3c7c</session_key>
  <checkpoint_dir>/Applications/splunk/var/lib/splunk/modinputs/twitter</checkpoint_dir>
  <configuration>
    <stanza name="twitter://SplunkTwitter">
      <param name="host">vgenovese-mbp15.sv.splunk.com</param>
      <param name="index">default</param>
      <param name="password">pass</param>
      <param name="username">splunker</param>
    </stanza>
  </configuration>
</input>
Input status endpoint
The input status endpoint is useful when troubleshooting modular inputs. It can help you determine issues such as the following:
- Is a modular input script running?
- Why is there no searchable data?
- How much data did the script stream?
The input status is available from the following management endpoint:
https://localhost:8089/services/admin/inputstatus
Note: 8089 is the default management port. Your management port may be different.
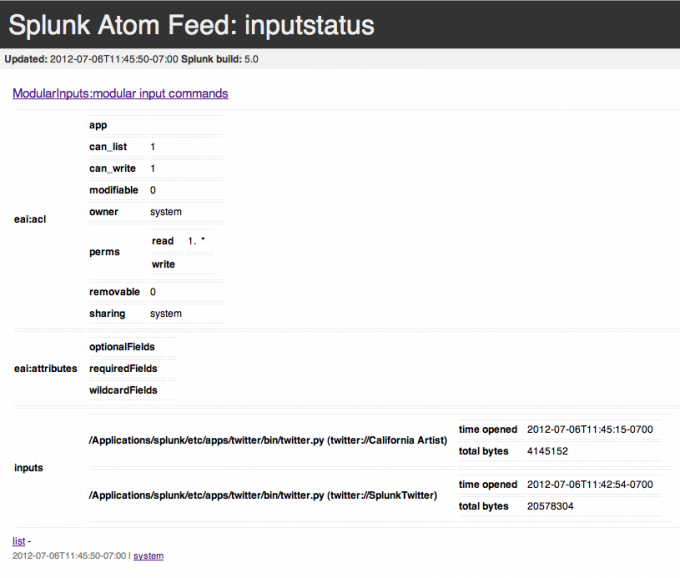
From the management endpoint for input status, you can find a link to ModularInputs:modular input command that lists all modular inputs, their location in the system, the number of bytes indexed, and their status.
For example, here is the input status for the Twitter modular input example:
The input status endpoint only includes actual data. In the case of XML streaming, it only includes the number of bytes within the <data> tags. If a script has started and then exited for whatever reason, the exit status description contains a human-readable string that explains why the script exited. For example it may say "exited with code 0."
Track a modular input script
If your script provides any type of logging to stderr (for example a logger output, or a python stack trace printed to stderr by the interpreter), these contents are written to splunkd.log, as described in the section Set up logging.
You can search the log file to retrieve the logging data. The following example searches for the output from any script spawned by the modinputs framework. This includes any messages from the ExecProcessor system component, which is responsible for running and managing the scripts. You can modify this search according to your specific needs.
index=_internal source=*splunkd.log* (component=ModularInputs stderr) OR component=ExecProcessor
| Create a custom user interface | Modular inputs examples |
This documentation applies to the following versions of Splunk® Enterprise: 7.0.0, 7.0.1, 7.0.2, 7.0.3, 7.0.4, 7.0.5, 7.0.6, 7.0.7, 7.0.8, 7.0.9, 7.0.10, 7.0.11, 7.0.13, 7.1.0, 7.1.1, 7.1.2, 7.1.3, 7.1.4, 7.1.5, 7.1.6, 7.1.7, 7.1.8, 7.1.9, 7.1.10, 7.2.0, 7.2.1, 7.2.2, 7.2.3, 7.2.4, 7.2.5, 7.2.6, 7.2.7, 7.2.8, 7.2.9, 7.2.10, 7.3.0, 7.3.1, 7.3.2, 7.3.3, 7.3.4, 7.3.5, 7.3.6, 7.3.7, 7.3.8, 7.3.9, 8.0.0, 8.0.1, 8.0.2, 8.0.3, 8.0.4, 8.0.5, 8.0.6, 8.0.7, 8.0.8, 8.0.9, 8.0.10, 8.1.0, 8.1.1, 8.1.2, 8.1.3, 8.1.4, 8.1.5, 8.1.6, 8.1.7, 8.1.8, 8.1.9, 8.1.10, 8.1.11, 8.1.12, 8.1.13, 8.1.14, 8.2.0, 8.2.1, 8.2.2, 8.2.3, 8.2.4, 8.2.5, 8.2.6, 8.2.7, 8.2.8, 8.2.9, 8.2.10, 8.2.11, 8.2.12, 9.0.0, 9.0.1, 9.0.2, 9.0.3, 9.0.4, 9.0.5, 9.0.6, 9.0.7, 9.0.8, 9.0.9, 9.0.10, 9.1.0, 9.1.1, 9.1.2, 9.1.3, 9.1.4, 9.1.5, 9.1.6, 9.1.7, 9.1.8, 9.1.9, 9.2.0, 9.2.1, 9.2.2, 9.2.3, 9.2.4, 9.2.5, 9.2.6, 9.3.0, 9.3.1, 9.3.2, 9.3.3, 9.3.4, 9.4.0, 9.4.1, 9.4.2


 Download manual
Feedback submitted, thanks!