Analyzing data in the Analytics Workspace
Your team manages a bike share program that allows users to check out bicycles using a mobile application.
To gain better insight into your business, you want to analyze the following metrics:
- Inventory status over time
- User availability checks over time
- Social media mentions over time
- User sentiment over time
This use case uses a metrics data source designed to help you get started with the Analytics Workspace. To work through this use case, you need the following:
- Admin-level access
- Unzipped sample data
Create a metrics index and upload the sample data using Splunk Web. Then locate and analyze your data in the Analytics Workspace.
- Create a metrics index
- Upload data from a CSV file
- Locate your data in the Analytics Workspace
- Analyze your data in the Analytics Workspace
Create a metrics index
- In Splunk Web, navigate to Settings > Indexes and click New Index.
- For Index Name, type "bikes".
- For Index Data Type, click Metrics.
- For the remaining properties of the index, use the default values.
- Click Save.
Upload data from a CSV file
- In Splunk Web, go to Settings > Add Data.
- Scroll down and click Upload files from my computer.
- Under Select Source, click Select File.
- Locate the
metrics-sample-bikes.csvfile in your file directory system, and click Open. - After the file uploads to Splunk Web, click Next.
- Under Set Source Type, click the Source type drop-down list, and click Metrics > metrics_csv. Then click Next.
- (Optional) On the Input Settings page, under Host, specify a host value.
- On the Input Settings page, under Index, select bikes. Then click Review.
- Review your data upload settings. Then click Submit.
Locate your data in the Analytics Workspace
- Navigate to the Search & Reporting app.
- Click the Analytics tab to open the Analytics Workspace.
- In the Data panel, click Metrics to view a list of metrics data sources. DemoBikeMetrics appears in the list of metrics data sources.

Analyze your data in the Metrics Workspace
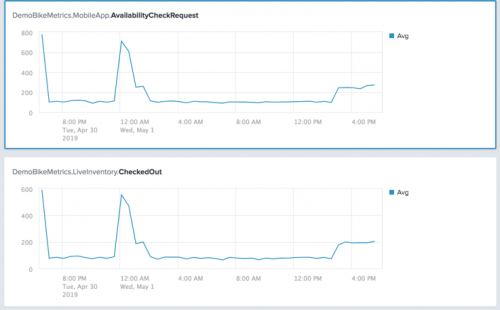
- To view a chart showing checked-out bike inventory over time, click Metrics > DemoBikeMetrics > LiveInventory > CheckedOut.
- In the global actions bar, click the time range picker, and select Last 48 hours. The workspace time range expands to show a wider range of data.
- To view a chart showing user availability checks over time, click Metrics > DemoBikeMetrics > MobileApp > AvailabilityCheckRequests.
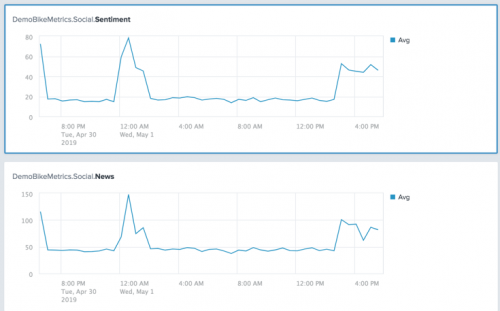
- To view a chart showing social media mentions over time, click Metrics > DemoBikeMetrics > Social > News.
- To view a chart showing user sentiment over time, click Metrics > DemoBikeMetrics > Social > Sentiment.
- To view how your metrics vary based on location, click Split By in the main panel of the Analytics Workspace. Select city from the
Split Bymenu and click Apply. - To view the workspace in grid layout, click the grid icon
 in the global actions bar.


Summary
From the charts in the workspace, you can deduce that there is a positive correlation between checked-out inventory and user availability requests. There is also a positive correlation between social media mentions and user sentiment. These metrics all peak during certain times of the day, most likely during typical commute hours.
For more information about analyzing data in the Analytics Workspace, see Analytics in the Analytics Workspace.
| Dashboards in the Analytics Workspace | Creating a dashboard in the Analytics Workspace |
This documentation applies to the following versions of Splunk® Enterprise: 8.2.0, 8.2.1, 8.2.2, 8.2.3, 8.2.4, 8.2.5, 8.2.6, 8.2.7, 8.2.8, 8.2.9, 8.2.10, 8.2.11, 8.2.12, 9.0.0, 9.0.1, 9.0.2, 9.0.3, 9.0.4, 9.0.5, 9.0.6, 9.0.7, 9.0.8, 9.0.9, 9.0.10, 9.1.0, 9.1.1, 9.1.2, 9.1.3, 9.1.4, 9.1.5, 9.1.6, 9.1.7, 9.1.8, 9.1.9, 9.2.0, 9.2.1, 9.2.2, 9.2.3, 9.2.4, 9.2.5, 9.2.6, 9.3.0, 9.3.1, 9.3.2, 9.3.3, 9.3.4, 9.4.0, 9.4.1, 9.4.2
Feedback submitted, thanks!