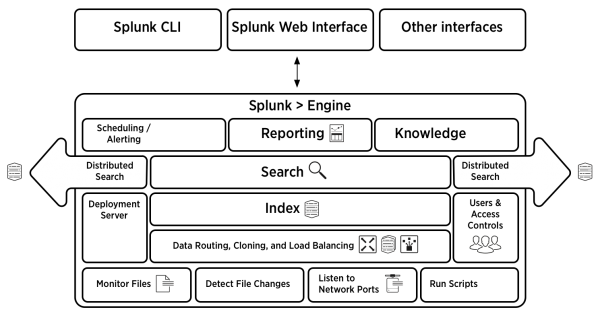
Splunk Enterprise architecture and processes
This topic discusses the internal architecture and processes of Splunk Enterprise at a high level. If you're looking for information about third-party components used in Splunk Enterprise, see the credits section in the Release notes.
Splunk Enterprise Processes
A Splunk Enterprise server installs a process on your host, splunkd.
splunkd is a distributed C/C++ server that accesses, processes and indexes streaming IT data. It also handles search requests. splunkd processes and indexes your data by streaming it through a series of pipelines, each made up of a series of processors.
- Pipelines are single threads inside the
splunkdprocess, each configured with a single snippet of XML. - Processors are individual, reusable C or C++ functions that act on the stream of IT data that passes through a pipeline. Pipelines can pass data to one another through queues.
- New for version 6.2,
splunkdalso provides the Splunk Web user interface. It lets users search and navigate data and manage Splunk Enterprise deployment through a Web interface. It communicates with your Web browser through REpresentational State Transfer (REST). splunkdruns a Web server on port 8089 with SSL/HTTPS turned on by default.- It also runs a Web server on port 8000 with SSL/HTTPS turned off by default.
Splunk Enterprise processes require network connectivity. For a table and diagrams showing the network ports used, see Components and their relationship with the network in the Inherit a Splunk Enterprise Deployment manual.
splunkweb installs as a legacy service on Windows only. Prior to version 6.2, it provided the Web interface for Splunk Enterprise. Now, it installs and runs, but quits immediately. You can configure it to run in "legacy mode" by changing a configuration parameter.
On Windows systems, splunkweb.exe is a third-party, open-source executable that Splunk renames from pythonservice.exe. Because it is a renamed file, it does not contain the same file version information as other Splunk Enterprise for Windows binaries.
Read information on other Windows third-party binaries that come with Splunk Enterprise.
Splunk Enterprise and Windows in Safe Mode
If Windows is in Safe Mode, Splunk services do not start. If you attempt to start Splunk Enterprise from the Start Menu while in Safe Mode, Splunk Enterprise does not alert you to the fact that its services are not running.
Additional processes for Splunk Enterprise on Windows
On Windows instances of Splunk Enterprise, in addition to the two services described, Splunk Enterprise uses additional processes when you create specific data inputs on a Splunk Enterprise instance. These inputs run when configured by certain types of Windows-specific data input.
splunk.exe
splunk.exe is the control application for the Windows version of Splunk Enterprise. It provides the command-line interface (CLI) for the program. It lets you start, stop, and configure Splunk Enterprise, similar to the *nix splunk program.
The splunk.exe binary requires an elevated context to run because of how it controls the splunkd and splunkweb processes. Splunk Enterprise might not function correctly if this program does not have the appropriate permissions on your Windows system. This is not an issue if you install Splunk Enterprise as the Local System user.
splunk-admon
splunk-admon.exe runs whenever you configure an Active Directory (AD) monitoring input. splunkd spawns splunk-admon, which attaches to the nearest available AD domain controller and gathers change events generated by AD. Splunk Enterprise stores these events in an index.
splunk-perfmon
splunk-perfmon.exe runs when you configure Splunk Enterprise to monitor performance data on the local Windows machine. This binary attaches to the Performance Data Helper libraries, which query the performance libraries on the system and extract performance metrics both instantaneously and over time.
splunk-netmon
splunk-netmon runs when you configure Splunk Enterprise to monitor Windows network information on the local machine.
splunk-regmon
splunk-regmon.exe runs when you configure a Registry monitoring input in Splunk. This input initially writes a baseline for the Registry in its current state (if requested), then monitors changes to the Registry over time.
splunk-winevtlog
You can use this utility to test defined event log collections, and it outputs events as they are collected for investigation. Splunk Enterprise has a Windows event log input processor built into the engine.
splunk-winhostmon
splunk-winhostmon runs when you configure a Windows host monitoring input in Splunk. This input gets detailed information about Windows hosts.
splunk-winprintmon
splunk-winprintmon runs when you configure a Windows print monitoring input in Splunk. This input gets detailed information about Windows printers and print jobs on the local system.
splunk-wmi
When you configure a performance monitoring, event log or other input against a remote computer, this program runs. Depending on how you configure the input, it either attempts to attach to and read Windows event logs as they come over the wire, or executes a Windows Query Language (WQL) query against the Windows Management Instrumentation (WMI) provider on the specified remote machine.
Architecture diagram
| System requirements for use of Splunk Enterprise on-premises | Information on Windows third-party binaries that come with Splunk Enterprise |
This documentation applies to the following versions of Splunk® Enterprise: 7.0.0, 7.0.1, 7.0.2, 7.0.3, 7.0.4, 7.0.5, 7.0.6, 7.0.7, 7.0.8, 7.0.9, 7.0.10, 7.0.11, 7.0.13, 7.1.0, 7.1.1, 7.1.2, 7.1.3, 7.1.4, 7.1.5, 7.1.6, 7.1.7, 7.1.8, 7.1.9, 7.1.10, 7.2.0, 7.2.1, 7.2.2, 7.2.3, 7.2.4, 7.2.5, 7.2.6, 7.2.7, 7.2.8, 7.2.9, 7.2.10, 7.3.0, 7.3.1, 7.3.2, 7.3.3, 7.3.4, 7.3.5, 7.3.6, 7.3.7, 7.3.8, 7.3.9, 8.0.0, 8.0.1, 8.0.2, 8.0.3, 8.0.4, 8.0.5, 8.0.6, 8.0.7, 8.0.8, 8.0.9, 8.0.10, 8.1.0, 8.1.1, 8.1.2, 8.1.3, 8.1.4, 8.1.5, 8.1.6, 8.1.7, 8.1.8, 8.1.9, 8.1.10, 8.1.11, 8.1.12, 8.1.13, 8.1.14, 8.2.0, 8.2.1, 8.2.2, 8.2.3, 8.2.4, 8.2.5, 8.2.6, 8.2.7, 8.2.8, 8.2.9, 8.2.10, 8.2.11, 8.2.12, 9.0.0, 9.0.1, 9.0.2, 9.0.3, 9.0.4, 9.0.5, 9.0.6, 9.0.7, 9.0.8, 9.0.9, 9.0.10, 9.1.0, 9.1.1, 9.1.2, 9.1.3, 9.1.4, 9.1.5, 9.1.6, 9.1.7, 9.1.8, 9.1.9, 9.2.0, 9.2.1, 9.2.2, 9.2.3, 9.2.4, 9.2.5, 9.2.6, 9.3.0, 9.3.1, 9.3.2, 9.3.3, 9.3.4, 9.4.0, 9.4.1, 9.4.2

 Download manual
Feedback submitted, thanks!