Search and monitor metrics
To analyze data in a metrics index, use mstats, which is a reporting command. Using mstats you can apply metric aggregations to isolate and correlate problems from different data sources. See mstats in the Search Reference manual.
To search on individual metric data points at smaller scale, free of mstats aggregation, use the mpreview command. The mpreview command is a tool for the onboarding and troubleshooting of metrics data and the exploration of metrics indexes. See mpreview in the Search Reference manual.
To convert log events to metric data points at search time and write those metric data points to a metrics index, use the mcollect or meventcollect commands. See mcollect and meventcollect in the Search Reference manual.
To enumerate metric names, dimensions, and values, use mcatalog, which is an internal search command. See mcatalog in the Search Reference manual.
Other search commands do not work with a metrics index.
Note the following differences:
- You cannot use automatic lookups with metrics data. This is because automatic lookups are applied to individual events, whereas metrics are analyzed as an aggregate.
- You cannot perform search-time extractions.
- You can enrich metrics with the equivalent of custom indexed fields, which are treated as dimensions.
- You can use reserved fields such as "source", "sourcetype", or "host" as dimensions. However, when extracted dimension names are reserved names, the name is prefixed with "extracted_" to avoid name collision. For example, if a dimension name is "host", search for "extracted_host" to find it.
- Dimensions that start with underscore ( _ ) are not indexed, so they are not searchable.
As of release 8.0.0 of the Splunk platform, metrics indexing and search is case sensitive. This means, for example, that metrics search commands treat the following as three distinct metrics: cap.gear, CAP.GEAR, and Cap.Gear.
Search examples
To list all metric names in all metrics indexes:
| mcatalog values(metric_name) WHERE index=*
To list all dimensions in all metrics indexes:
| mcatalog values(_dims) WHERE index=*
To list counts of metric names over 10-second intervals:
| mstats count where metric_name=* span=10s BY metric_name
To perform a simple count of a metric:
| mstats count where index=mymetricsdata metric_name=aws.ec2.CPUUtilization
To calculate an average value of measurements for every 30-second interval:
| mstats avg(_value) WHERE index=mymetricdata AND metric_name=aws.ec2.CPUUtilization span=30s
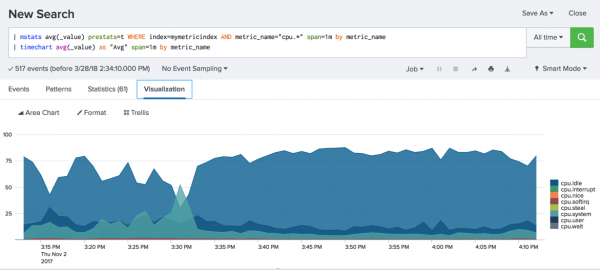
You can also display results in a chart. The following example uses a wildcard search and group by:
| mstats avg(_value) prestats=t WHERE index=mymetricindex AND metric_name="cpu.*" span=1m by metric_name
| timechart avg(_value) as "Avg" span=1m by metric_name
This type of search can be used to stack different CPU metrics that add up to 100%.
This search shows an example of using an EVAL statement:
| mstats avg(_value) as "Avg" WHERE metric_name="memory.free.value" span=5s
| eval mem_gb = Avg / 1024 / 1024 / 1024
| timechart max("mem_gb") span=5s
Use the REST API to list metrics data
You can also use the Metrics Catalog REST API endpoints to enumerate metrics data:
- Use the
GET /services/catalog/metricstore/metricsendpoint to list metric names. - Use the
GET /services/catalog/metricstore/dimensionsendpoint to list dimension names. - Use the
GET /services/catalog/metricstore/dimensions/{dimension-name}/valuesendpoint to list values for given dimensions.
You can also use filters with these endpoints to limit results by index, dimension, and dimension values.
See Metrics Catalog endpoint descriptions in the REST API Reference Manual.
| Visualize metrics in the Analytics Workspace | Perform statistical calculations on metric time series |
This documentation applies to the following versions of Splunk® Enterprise: 8.1.0, 8.1.1, 8.1.2, 8.1.3, 8.1.4, 8.1.5, 8.1.6, 8.1.7, 8.1.8, 8.1.9, 8.1.10, 8.1.11, 8.1.12, 8.1.13, 8.1.14, 8.2.0, 8.2.1, 8.2.2, 8.2.3, 8.2.4, 8.2.5, 8.2.6, 8.2.7, 8.2.8, 8.2.9, 8.2.10, 8.2.11, 8.2.12, 9.0.0, 9.0.1, 9.0.2, 9.0.3, 9.0.4, 9.0.5, 9.0.6, 9.0.7, 9.0.8, 9.0.9, 9.0.10, 9.1.0, 9.1.1, 9.1.2, 9.1.3, 9.1.4, 9.1.5, 9.1.6, 9.1.7, 9.1.8, 9.1.9, 9.2.0, 9.2.1, 9.2.2, 9.2.3, 9.2.4, 9.2.5, 9.2.6, 9.3.0, 9.3.1, 9.3.2, 9.3.3, 9.3.4, 9.4.0, 9.4.1, 9.4.2

 Download manual
Feedback submitted, thanks!