Search and Reporting app
By default, provides the Search and Reporting app. This interface provides the core functionality of . The Splunk Home page provides a link to the app when you first log into Splunk Web.
Find Splunk Search and Reporting
- If you are not on the Splunk Home page, click the Splunk logo on the Splunk bar to go to Splunk Home.
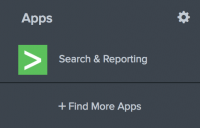
- From Splunk Home, click Search & Reporting in the Apps panel.
This opens the Search Summary view in the Search app.
Search Summary view
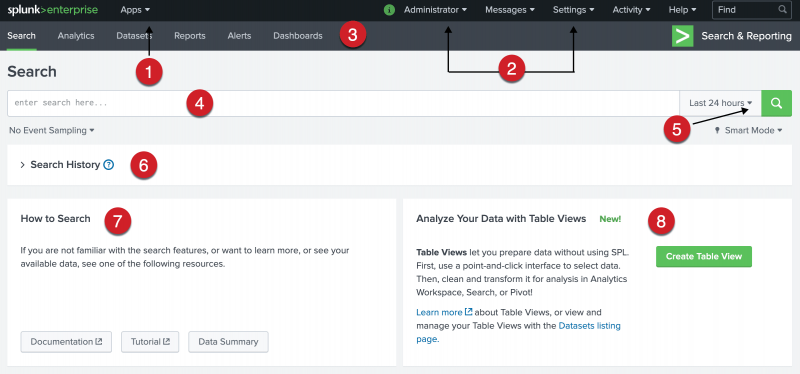
The Search Summary view includes common elements that you see on other views, including the Applications menu, the Splunk bar, the Apps bar, the Search bar, and the Time Range Picker. Elements that are unique to the Search Summary view are the panels below the Search bar: the How to Search panel, the What to Search panel, and the Search History panel.
Before you run a search, the Search summary view displays the following elements: App bar, Search bar, Time range picker, How to Search panel, Search History panel, and the Analyze Your Data with Table Views panel.
Some of these are common elements that you see on other views. Elements that are unique to the Search Summary view are the panels below the Search bar.
| Number | Element | Description |
|---|---|---|
| 1 | Applications menu | Switch between Splunk applications that you have installed. The current application, Search & Reporting app, is listed. This menu is on the Splunk bar. |
| 2 | Splunk bar | Edit your Splunk configuration, view system-level messages, and get help on using the product. |
| 3 | Apps bar | Navigate between the different views in the application you are in. For the Search & Reporting app the views are: Search, Datasets, Reports, Alerts, and Dashboards. |
| 4 | Search bar | Specify your search criteria. |
| 5 | Time range picker | Specify the time period for the search, such as the last 30 minutes or yesterday. The default is Last 24 hours. |
| 6 | Search history | View a list of the searches that you have run. The search history appears after you run your first search. |
| 7 | How to Search | Use the links to learn more about how to start searching your data, as well a summary of the data that you have access to. |
| 8 | Analyze Your Data with Table Views | Create curated collections of event data into datasets that you design for a specific business purpose. |
| Apps and add-ons | Configure Splunk Web to open directly to an app |
This documentation applies to the following versions of Splunk® Enterprise: 8.1.0, 8.1.1, 8.1.2, 8.1.3, 8.1.4, 8.1.5, 8.1.6, 8.1.7, 8.1.8, 8.1.9, 8.1.10, 8.1.11, 8.1.12, 8.1.13, 8.1.14, 8.2.0, 8.2.1, 8.2.2, 8.2.3, 8.2.4, 8.2.5, 8.2.6, 8.2.7, 8.2.8, 8.2.9, 8.2.10, 8.2.11, 8.2.12, 9.0.0, 9.0.1, 9.0.2, 9.0.3, 9.0.4, 9.0.5, 9.0.6, 9.0.7, 9.0.8, 9.0.9, 9.0.10, 9.1.0, 9.1.1, 9.1.2, 9.1.3, 9.1.4, 9.1.5, 9.1.6, 9.1.7, 9.1.8, 9.1.9, 9.2.0, 9.2.1, 9.2.2, 9.2.3, 9.2.4, 9.2.5, 9.2.6, 9.3.0, 9.3.1, 9.3.2, 9.3.3, 9.3.4, 9.4.0, 9.4.1, 9.4.2


 Download manual
Feedback submitted, thanks!